- December 18, 2024
- Posted By: mia
- Category: Market News
GBP/USD Forecast: Bullish Recovery or Reversal Ahead?
The GBPUSD forex pair, commonly known as “Cable,” is one of the most actively traded currency pairs globally, reflecting the exchange rate between the British Pound (GBP) and the US Dollar (USD). It plays a significant role in international trade and investment, given its historical importance and liquidity. The pair’s fundamental outlook is heavily influenced by macroeconomic news from both the UK and the US, making it a key focus for traders seeking opportunities in the forex market.
For the GBP/USD news analysis today, upcoming US Building Permits and Housing Starts data are crucial for gauging future construction activity, a leading indicator of economic health in the United States. If the actual results exceed forecasts, it is likely to strengthen the USD, potentially pushing GBPUSD lower. On the UK side, Consumer Price Index (CPI) and Producer Price Index (PPI) data are central as they provide critical insights into inflationary pressures. Higher-than-expected inflation data could bolster expectations of tighter monetary policy from the Bank of England (BoE), supporting the GBP. Additionally, traders will monitor crude oil inventories due to their indirect impact on USD through global economic sentiment. The Federal Reserve’s forward guidance on monetary policy remains a focal point, and any hawkish signals could strengthen the dollar further, maintaining the risks of a GBP/USD bearish bias.
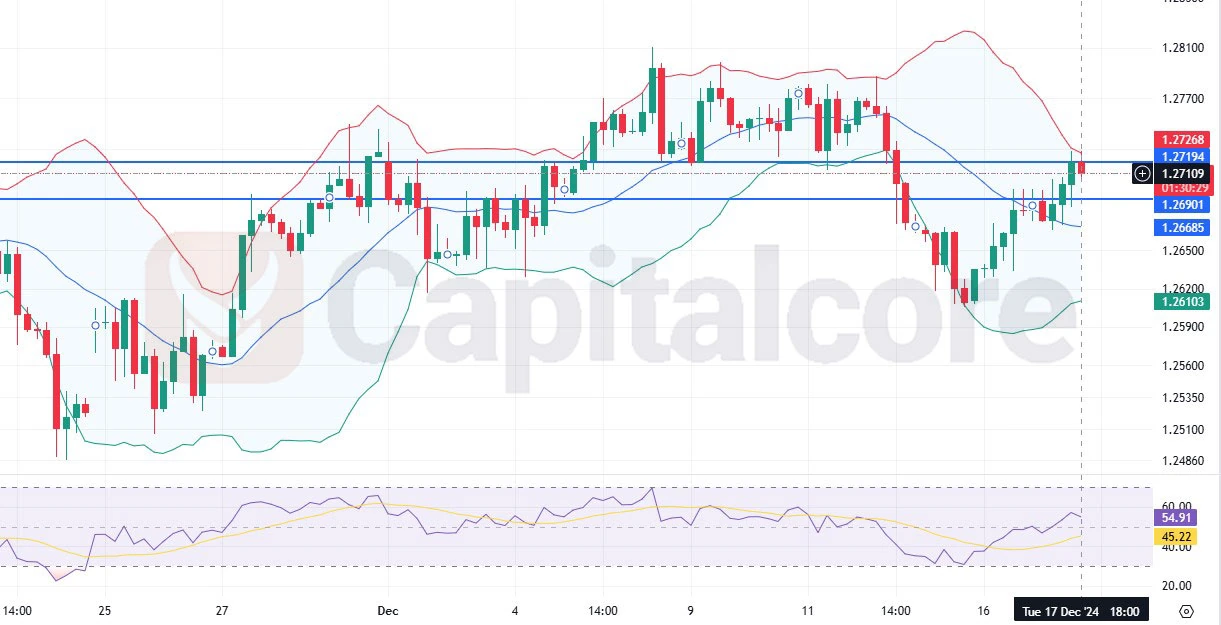
Chart Notes:
• Chart time-zone is UTC (+02:00)
• Candles’ time-frame is 4h.
The GBPUSD H4 chart shows a notable bullish recovery after a recent decline. The Bollinger Bands indicate that Cable’s price action is attempting to break above the middle band (20-SMA), a key dynamic resistance. If this breakout sustains, the pair could aim for the upper Bollinger Band near 1.2727, signaling further GBP/USD bullish momentum. However, failure to hold above the middle band may result in a pullback toward the lower support levels at 1.2668 and 1.2690.
The Relative Strength Index (RSI) currently stands at 54.91, showing a moderate recovery and indicating neutral momentum. The RSI remains below the 70 overbought level, suggesting room for further upside. If buying pressure continues, GBPUSD could challenge recent highs; however, traders should watch for potential reversals near key resistance zones. Overall, GBPUSD’s technical outlook today remains cautiously bullish as long as it stays above the 1.2668 support zone.
•DISCLAIMER: Please note that the above analysis is not an investment suggestion by “Capitalcore LLC”. This post has been published only for educational purposes.
