An ascending leg looks to be happening
The price line on GBP/USD chart has been descending within a bearish channel since the first of January 2021. The price line has made several reactions to the top, base and mid line of the channel; but has not yet been able to break the channel to either sides yet.
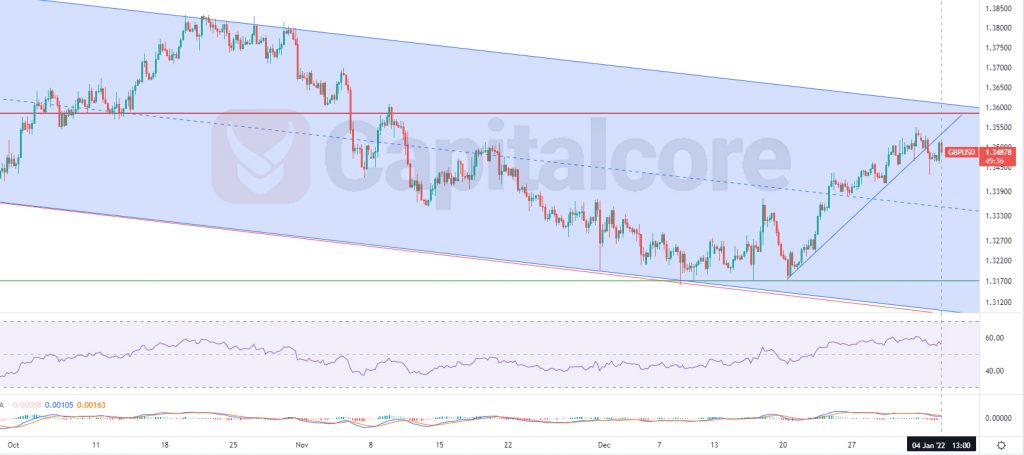
Chart Notes:
• Chart time-zone is UTC (+03:00)
• Candles’ time-frame is 4h.
The price at the moment is on 1.34488, which would be almost at the top of the channel and very close to level 0.236 of the Fibonacci retracement on the previous ascending wave. The temporary support level below the price line, that has been indicated as a blue line, has broken and the price has made a pullback to the area as well. The most important resistance level around the price line lays on 1.355- 1.36 . The resistance area is of high importance as the price line has reacted to it several times and also it is around level 0.236 of the Fibonacci level as well as the top line of the channel. Sellers can wait for the price to have another retest of the broken dynamic support, and around level 0.236 of the Fibonacci retracement, they can open short positions. The target for the descending wave could be 1.339 and 1.23166. Please consider that in case the price line breaks above 1.36, the chance for the descending wave would highly reduce.
• DISCLAIMER: Please note that the above analysis is not an investment suggestion by “Capitalcore Ltd”. This post has been published only for educational purposes.