GBP/USD bullish trend seems to be close to its end
UK’s Markit manufacturing PMI will be released in a few hours. CapitalCore Ltd believes this strong bullish trend will be followed by a bearish trend. In the following we have analyzed GBP/USD price chart. In case you are planning to open a position and in case below information matches with your trading strategy, this will be really useful for you.
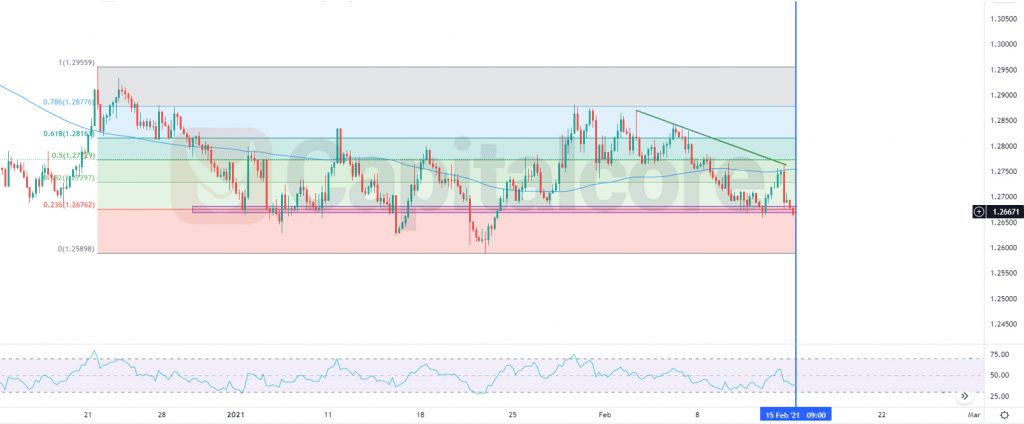
Chart Notes:
• Chart time-zone is UTC (+03:00)
• Candles’ time-frame is 4h.
The support rests at 1.31400 with resistance at 1.32990 which both lines are above the weekly pivot point at 1.30360. The EMA of 10 is moving with bullish bias in the ascendant channel and it is above the EMA of 100 and the EMA of 200. The RSI is moving in overbought area, the Stochastic is moving in high ranges and the MACD line is above the signal line in the positive territory. The ADX is showing buy signal.
It seems that GBPUSD has already created the correction pattern and it’s time for price decline. Sellers can target the middle Bollinger band at 1.31040.
• DISCLAIMER: Please note that the above analysis is not an investment suggestion by “Capitalcore Ltd”. This post has been published only for educational purposes.