Price line, touching the top of the ascending channel
Traders are still following the Brexit negotiations. On the chart GBP/USD has formed a descending channel. right now the price is touching the top of the channel and an out break is highly possible. No clear signal has been issued yet but the overall look of the chart is bearish.
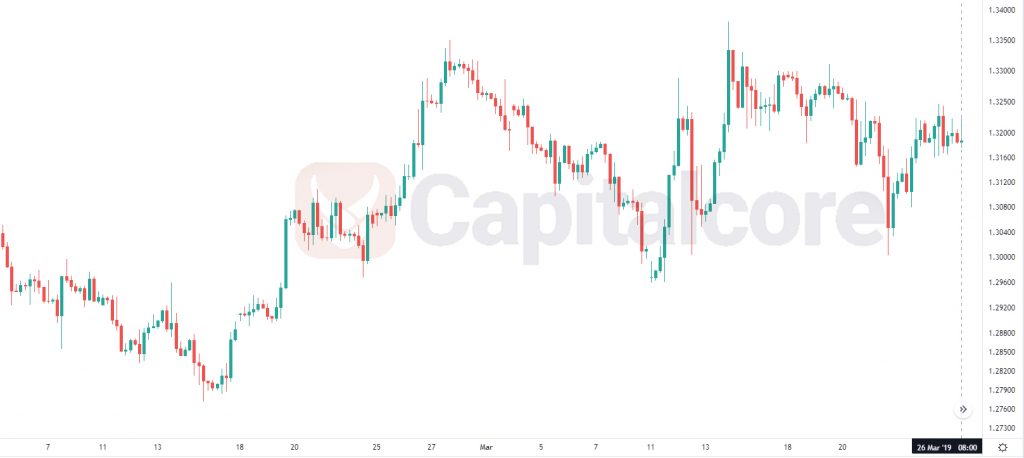
Chart Notes:
• Chart time-zone is UTC (+03:00)
• Candles’ time-frame is 4h.
The support rests at 1.31830 with resistance at 1.32240 which both lines are above the weekly pivot point at 1.31750. The EMA of 10 is moving horizontally in the descendant channel and it is above the EMA 200 and the EMA of 100. The RSI is moving on 50 level and the Stochastic is showing downward momentum. The MACD line is above the signal line in the positive territory. The ADX is showing weak buy signal.
It seems that GBPUSD is trying to find some consolidation within the Bollinger bands.
• DISCLAIMER: Please note that the above analysis is not an investment suggestion by “Capitalcore Ltd”. This post has been published only for educational purposes.