A sharp pump or a strong descend?
The movements of GBPUSD is observable in the support area and it is going to touch the second support level. The downward momentum of GBPUSD chart is a signal for short term traders. Currently the chart is not issuing any clear descend or ascend signals, checkingnext few candles are essential to predict the next move of the market.
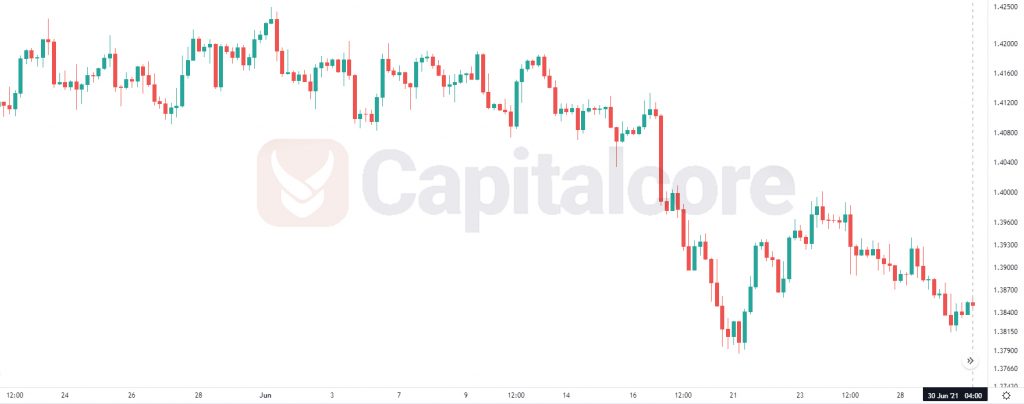
Chart Notes:
• Chart time-zone is UTC (+03:00)
• Candles’ time-frame is 4h.
The support rests at 1.38090 with resistance at 1.38810. The pivot point at 1.38470 is located below the price line. The EMA of 10 is moving with bearish bias in the descendant channel and it is below EMA of 200 and the EMA of 100. Stochastic is moving above the level of in high ranges. The RSI is moving in oversold area and the ADX is moving horizontally and not showing a clear signal. The MACD histogram is in negative territory.
• There is resistance at 1.38810, followed by resistance at 1. 1.39190 and 1.39530.
• There is support at 1.38090. Below, there is 1.37750 and 1.37370.
• DISCLAIMER: Please note that the above analysis is not an investment suggestion by “Capitalcore Ltd”. This post has been published only for educational purposes.