A trend reversal looks to be happening
GBP/USD price line started moving bullishly on January the 6th 2023. Within this trend, the value on this pair ascended about 5%, until it reached out to a strong resistance level; the bullish slope of the chart, then started descending and the bullish power is weakening.
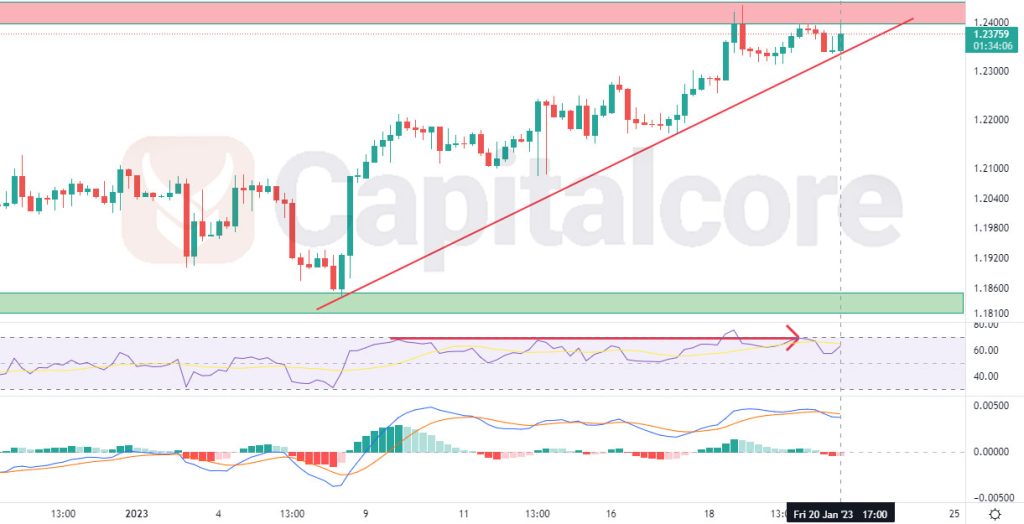
Chart Notes:
• Chart time-zone is UTC (+03:00)
• Candles’ time-frame is 4h.
The price line on GBP/USD price chart is currently showing 1.23759, located just below the resistance zone at 1.24000. This resistance zone, which is reflected as a red box above the price line, is of high importance, due to the several reactions the price line has made to it. The red ascending line indicates the trend line which has formed the current bullish wave. The green box below the price line indicates a strong support zone, which could be considered as the final target for the bears. RSI and MACD are both issuing bearish signals, RSI showing negative divergence and MACD have had a bearish cross over. Sellers could expect a bearish wave, after seeing the red trend line getting broken by the price line; pending sell orders could be placed on the red resistance zone.
• DISCLAIMER: Please note that the above analysis is not an investment suggestion by “Capitalcore Ltd”. This post has been published only for educational purposes.