No clear buy or sell signal is generated in GBP/USD price chart yet
UK might be leaving EU without a trade deal. Negative rates were permitted by the Central Bank in the future and the new wave of Pandemic will be a great threat for the economy. The price had a significant ascend and now looks to be on a correction phase, after finishing this phase better signals can be found in the chart. the following shows the current status of the GBP/USD price chart.
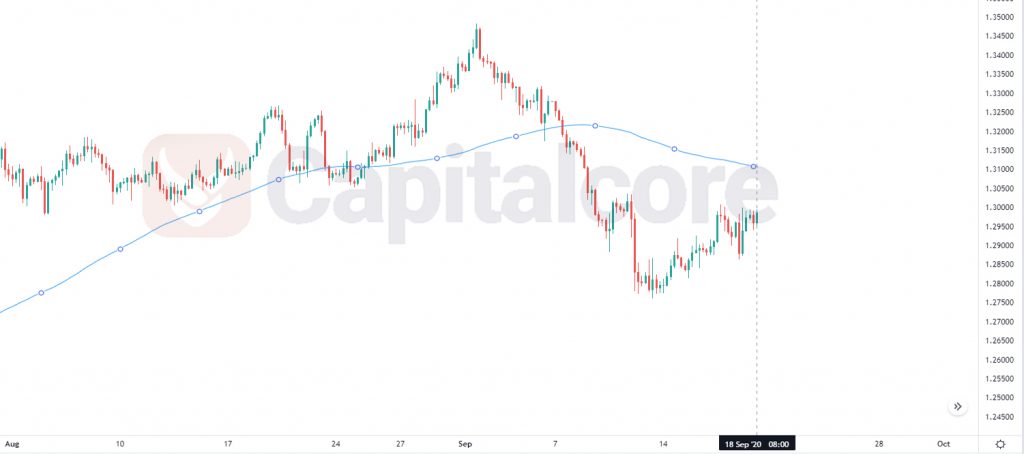
Chart Notes:
• Chart time-zone is UTC (+03:00)
• Candles’ time-frame is 4h.
The support rests at 1.28920 with resistance at 1.30060 which the weekly pivot point at 1.29430 is located in between the lines. The EMA of 10 is moving with bullish bias in the ascendant channel and it is below the EMA of 200 and the EMA of 100. The RSI is moving on level 50, the Stochastic is moving in high ranges and the MACD line is above the signal line in the positive territory. The ADX is not showing any clear signals.
GBPUSD is trying to complete the correction pattern targeting level 61.8 of Fibonacci at 1.32000.
• DISCLAIMER: Please note that the above analysis is not an investment suggestion by “Capitalcore Ltd”. This post has been published only for educational purposes.