- January 3, 2019
- Category: Market News
Lower Bollinger Band is pumping the price upwards
The UK manufacturing activity rose a little while the US Markit’s manufacturing PMI declined. On price chart the price is on a very strong support, different indicators are issuing trend reversal signal. The bearish power of the trend is decreasing and everything is ready for GBP to recover the loss against USD.
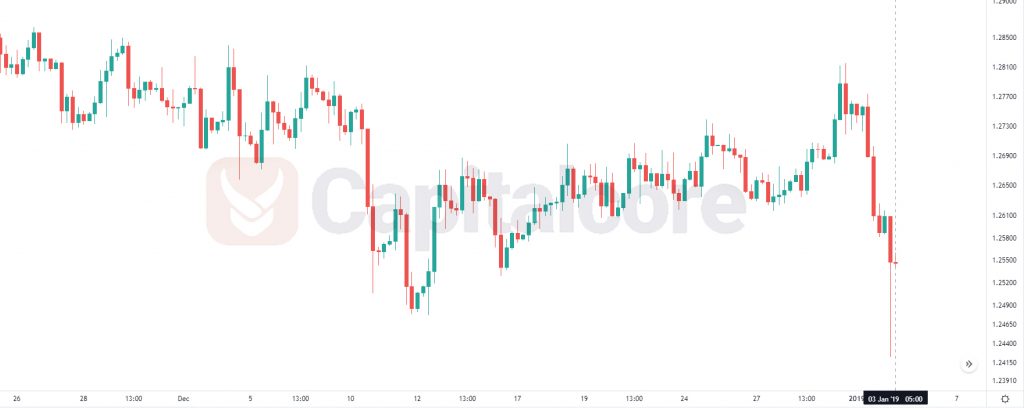
Chart Notes:
• Chart time-zone is UTC (+03:00)
• Candles’ time-frame is 4h.
The support rests at 1.25370 with resistance at 1.26090 which both lines are below the weekly pivot point at 1.26970. The EMA of 10 is moving with bearish bias in the descendant channel and it is below the EMA of 100 and the EMA of 200. The RSI is rising towards the 50 level, the Stochastic is showing upward momentum and the MACD line is below the signal line in the negative territory. The ADX is showing sell signal.
The price has already reached the lower Bollinger band therefore GBPUSD may grow towards 1.2660.
• DISCLAIMER: Please note that the above analysis is not an investment suggestion by “Capitalcore Ltd”. This post has been published only for educational purposes.