Head and shoulders pattern has formed
UK’s ILO unemployment rate could not support GBP against USD. On the chart, the price line has formed head and shoulder pattern and in case the price breaks below the neckline a strong descending phase will follow. The overall look of the chart is bearish.
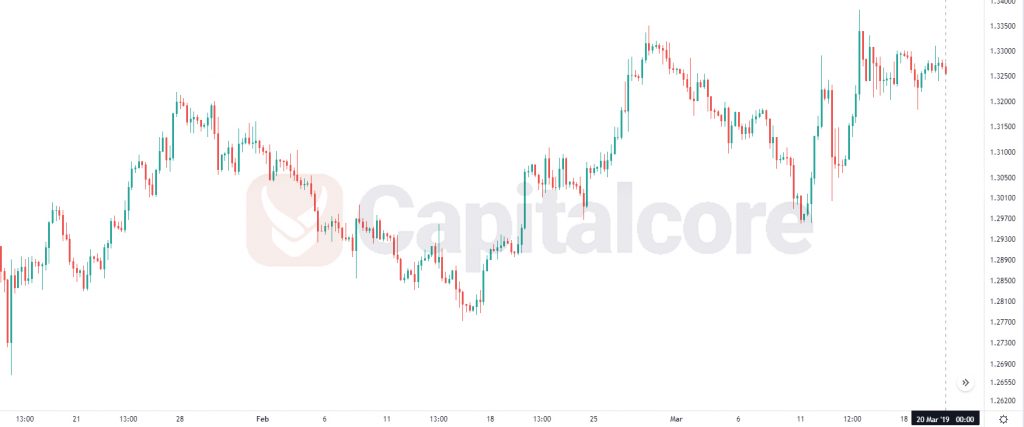
Chart Notes:
• Chart time-zone is UTC (+03:00)
• Candles’ time-frame is 4h.
The support rests at 1.31890 with resistance at 1.32620 which the weekly pivot point at 1.32120 is located in between the lines. The EMA of 10 is moving horizontally in the ascendant channel and it is above the EMA 200 and the EMA of 100. The RSI is moving on the 50 level and the Stochastic is moving in low ranges. The MACD line is below the signal line in the negative territory. The ADX is showing sell signal.
The support level breakthrough may push the price down towards 1.31600.
• DISCLAIMER: Please note that the above analysis is not an investment suggestion by “Capitalcore Ltd”. This post has been published only for educational purposes.