Trend reversal seems highly potential
GBP/USD started a bearish trend on 23rd of February 2022; this descending wave caused the price line to dump up to almost 12.9% until 11th of July 2022, when it smoothly broke below a weekly support zone. The price line looks potential to go through a trend reversal.
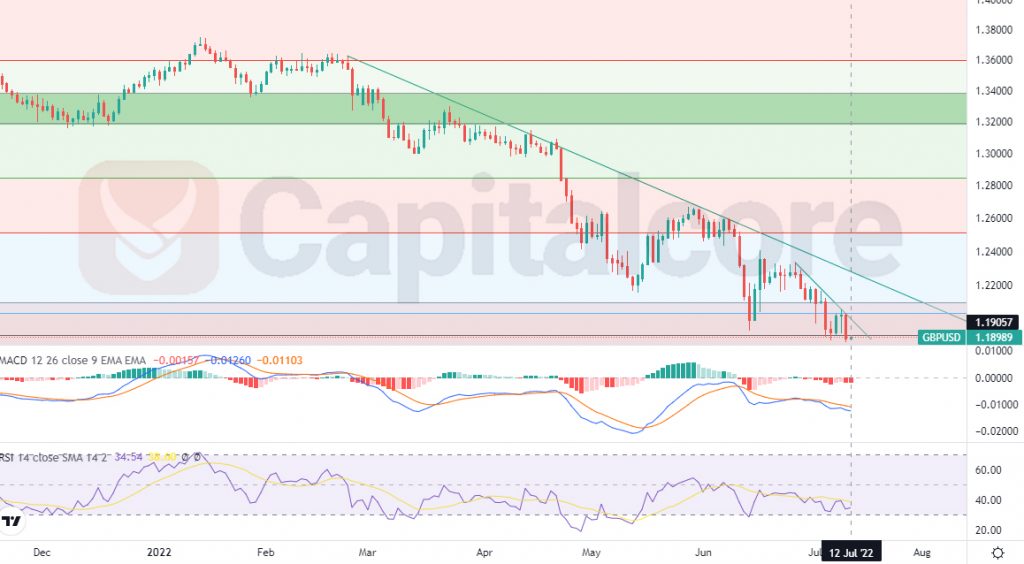
Chart Notes:
• Chart time-zone is UTC (+03:00)
• Candles’ time-frame is daily.
The price line on GBP/USD price chart, is indicating 1.18989 at the moment, which would be just below a strong resistance at 1.19057 – 1.205 . The area is indicated as a zone between a horizontal blue and a horizontal black line. The green lines on the chart indicate a short, and a long-term trend line which have formed the current descending wave, and leg on the chart. RSI is almost showing 32 and has issued positive divergence signals. MACD is showing negative trend, still on going, but this too, is reflecting a positive divergence. Traders can be waiting for the price line to break above the short, or the long trend line, based on their risk appetite, and they can enter long positions on the pullback to the area after that. The target for the ascending wave could be considered on 1.25 and 1.31 after that.
• DISCLAIMER: Please note that the above analysis is not an investment suggestion by “Capitalcore Ltd”. This post has been published only for educational purposes.