The support level looks too fragile to hold the price
After a sharp decline, USD/GBP is now issuing trend reversal signals. RSI is below 30, MACD is showing weakening of the descending trend. Ichimuko cloud is above the price line with a significant distance and most indicators are issuing buy signals.
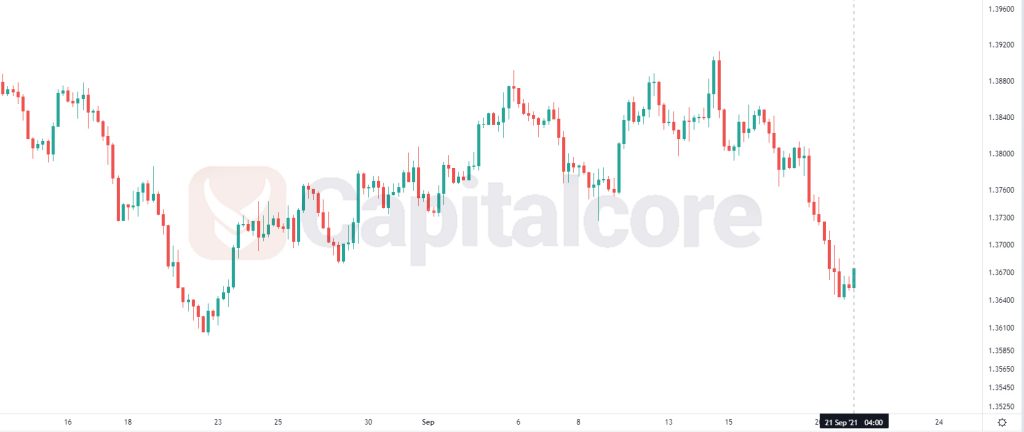
Chart Notes:
• Chart time-zone is UTC (+03:00)
• Candles’ time-frame is 4h.
The support rests at 1.36580 with resistance at 1.36840. The pivot point at 1.36660 is located above the price line. The EMA of 10 is moving with bearish bias in the descendant channel and it is below EMA of 200 and the EMA of 100. Stochastic is moving toward the level of 50. The RSI is moving in oversold area and the ADX is moving horizontally and not showing a clear signal. The MACD histogram is in negative territory.
• There is resistance at 1.36840, followed by resistance at 1.36920 and 1.37100.
• There is support at 1.36580. Below, there is 1.36400 and 1.36320.
• DISCLAIMER: Please note that the above analysis is not an investment suggestion by “Capitalcore Ltd”. This post has been published only for educational purposes.