GBP/USD is at the bottom of an ascending channel, with a strong resistance above it.
After a long a significant growth since march 23th 2020, GBP/USD is right now at a really critical spot. Here we checkout three possible moves which we believe have the highest potential to accrue in the next few weeks. Right now, the price on GBP/USD is around 1.381 and the price is at the bottom of an ascending channel. after multiple tries, it has not been able to break out of the strong resistance at around 1.39. on the other hand, we can see a strong support at about 1.36 which is 0.236 level of the previous strong ascending wave and had been able to pump the price upward a couple of times before.
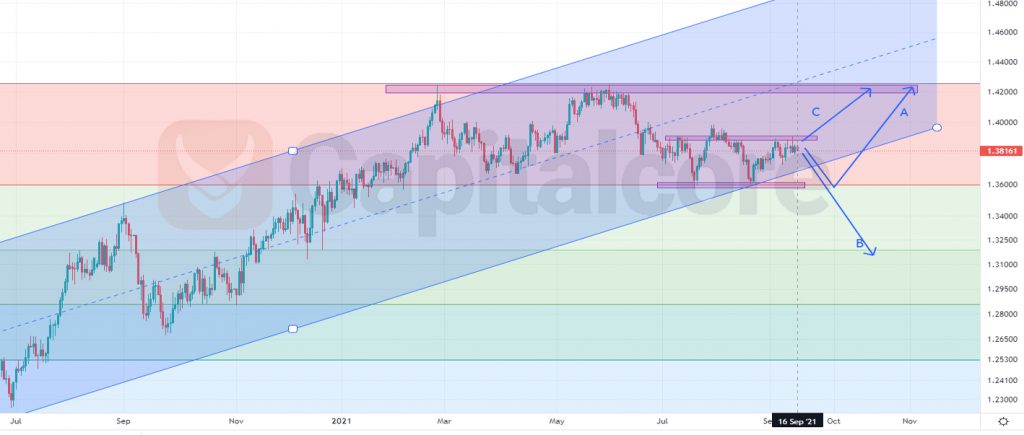
Chart Notes:
• Chart time-zone is UTC (+03:00)
• Candles’ time-frame is daily.
So based on what we can see on the chart, there are three possible outcomes for GBP/USD chart in the next few days:
• A: After another retest of the support on 1.36, in case we can see any trend reversal signals in 1 or 4 h candles. We can be waiting for another pump up to 1.39 – 1.40 and in case this resistance was broken we can be waiting to see the price at the next resistance level which is around 1.42 – 1.43.
• B: if the support at 1.36 can not hold the price after the next ascend, as it is the bottom of a long-term ascending channel and also 0.236 level of the Fibonacci retracement, the price is expected to descend majorly, up to the price 1.32.
• C: at any point, if the current up trend can break through the resistance at 1.39, we can be expecting to see the price at the next resistance at about 1.42.
• DISCLAIMER: Please note that the above analysis is not an investment suggestion by “Capitalcore Ltd”. This post has been published only for educational purposes.