- July 16, 2020
- Category: Market News
Bulls look to be getting tired
UK’s consumer price index increased along with the retail price index. On the chart, the bullish power seems to be reducing. The price line has formed a descending trend and a bearish move can be expected. In other words, a trend reversal is about to occur.
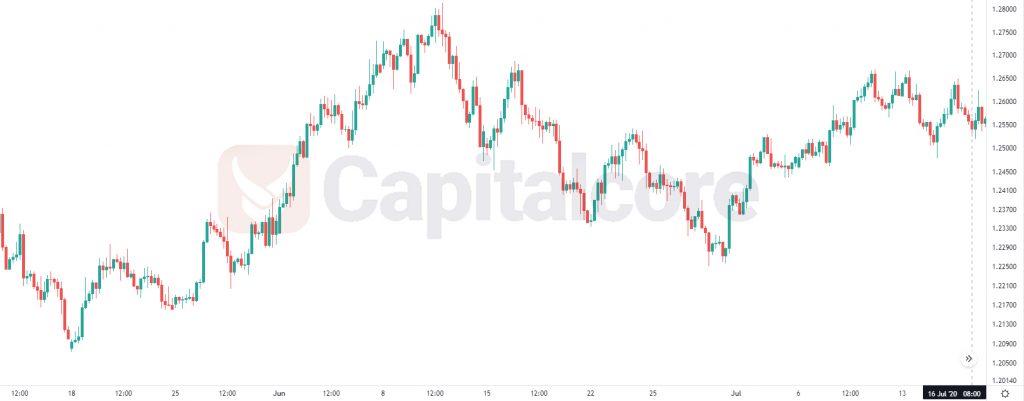
Chart Notes:
• Chart time-zone is UTC (+03:00)
• Candles’ time-frame is 4h.
The support rests at 1.25330 with resistance at 1.26020 which the weekly pivot point at 1.25860 is located in between the lines. The EMA of 10 is moving with bearish bias in the descendant channel and it is above the EMA of 200 and the EMA of 100. The RSI is falling below level 50, the Stochastic is moving in low ranges and the MACD line is below the signal line in the negative territory. The ADX is showing sell signal.
GBPUSD is under pressure, sellers can target level 50 of Fibonacci at 1.24640
• DISCLAIMER: Please note that the above analysis is not an investment suggestion by “Capitalcore Ltd”. This post has been published only for educational purposes.