GBP/USD, when does the ascending wave stop?!
During the last week GBPUSD increased by 120 points. There were no important economic reports in the UK yesterday but GBP remained in power so here we are investigating the reason of this big growth. The movement of the price on GBP/USD reveals some important information for technicalists.
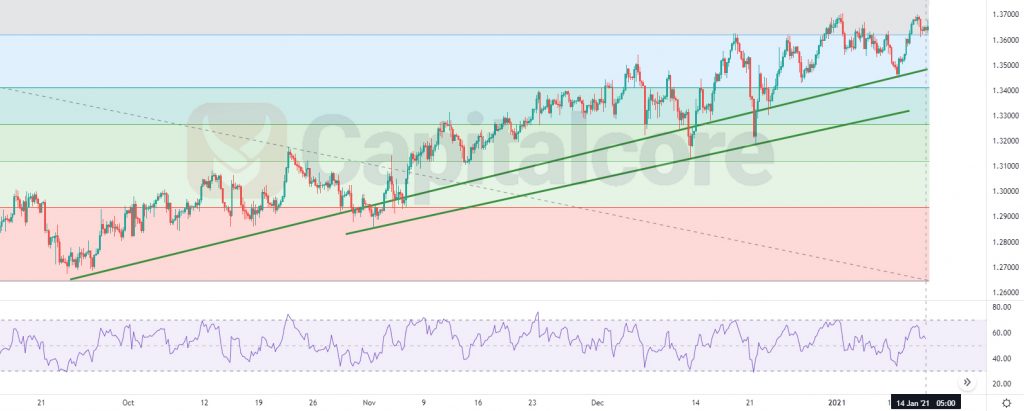
Chart Notes:
• Chart time-zone is UTC (+03:00)
• Candles’ time-frame is 4h.
The pair is finding support at 1.36510 with resistance at 1.37040 which the weekly pivot point at 1.35990 is located below the lines. The EMA of 10 is moving with bullish bias in the long term ascendant channel and it is above the EMA of 200 and the EMA of 100. The Stochastic is moving in high ranges. The RSI is falling towards level 50 and the MACD is moving in neutral territory. The ADX is showing sell signal.
While considering pullbacks on the way, buyers can expect 1.37700.
• DISCLAIMER: Please note that the above analysis is not an investment suggestion by “Capitalcore Ltd”. This post has been published only for educational purposes.