The next few candles will reveal the next move
Public Sector Net Borrowing will be released in the UK and the US will publish Crude Oil Inventories and FOMC Meeting Minutes. On the chart the price line is at the top of a descending channel. there is a strong support below the price and there has been no buy or sell signals issued.
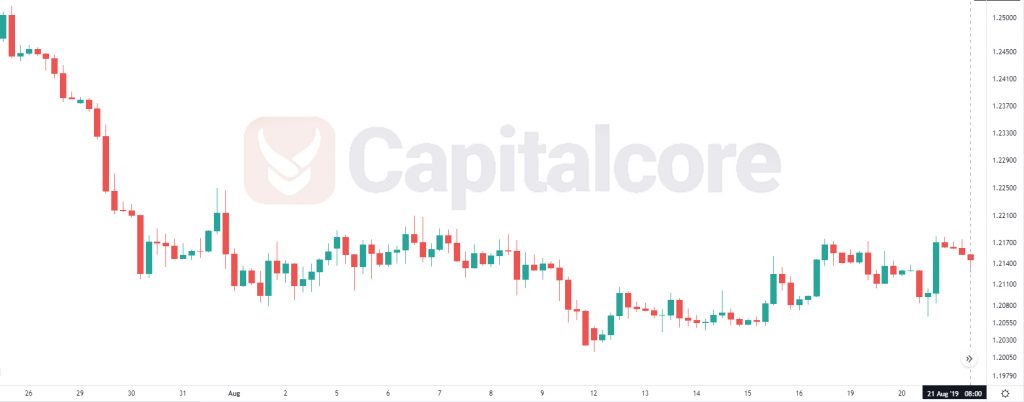
Chart Notes:
• Chart time-zone is UTC (+03:00)
• Candles’ time-frame is 4h.
The support rests at 1.20970 with resistance at 1.21900 which the weekly pivot point at 1.21140 is located in between the lines. The EMA of 10 is moving with bullish bias in the descendant channel and it is below the EMA 200 and the EMA of 100. The RSI is moving above 50 level and the Stochastic is moving in high ranges. The MACD line is above the signal line in the positive territory. The ADX is showing sell signal.
GBPUSD is moving in a tight range within Bollinger bands however, the resistance level breakout will confirm the bullish trend targeting 1.22200.
• DISCLAIMER: Please note that the above analysis is not an investment suggestion by “Capitalcore Ltd”. This post has been published only for educational purposes.