Bearish step seems close
UK’s Lloyd’s business barometer grew in June and UK’s gross domestic product data is the most influential factor for GBPUSD today. On the chart, the price has formed head and shoulders pattern, different indicators are issuing sell signal and bearish leg seems to be happening.
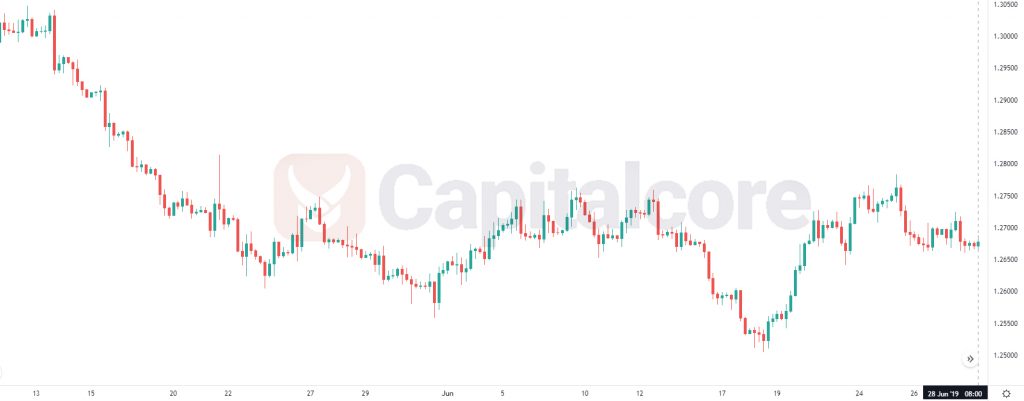
Chart Notes:
• Chart time-zone is UTC (+03:00)
• Candles’ time-frame is 4h.
The support rests at 1.26510 with resistance at 1.26900 which the weekly pivot point at 1.26670 is located in between the lines. The EMA of 10 is moving horizontally in the horizontal channel and it is below the EMA 200 and above the EMA of 100. The RSI is moving below 50 level and the Stochastic is moving in low ranges. The MACD line is below the signal line in the negative territory. The ADX is not showing any clear signals.
GBPUSD is moving in a tight range, the support level breakthrough will push the price down towards 1.2640.
• DISCLAIMER: Please note that the above analysis is not an investment suggestion by “Capitalcore Ltd”. This post has been published only for educational purposes.