Trend reversal signals have been issued
There has been a decline in UK’s Rightmove House Price Index. On the chart the price line has reached a very strong resistance. The bullish power is decreasing and different indicators and oscillators are issuing trend reversal signal. A bearish step is expected.
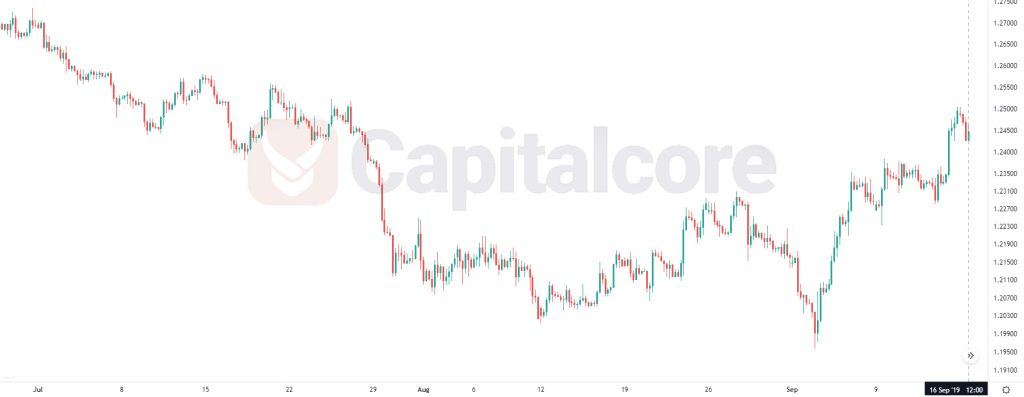
Chart Notes:
• Chart time-zone is UTC (+03:00)
• Candles’ time-frame is 4h.
The support rests at 1.24250 with resistance at 1.25090 which both lines are above the weekly pivot point at 1.24120. The EMA of 10 is moving with bullish bias in the ascendant channel and it is above the EMA 200 and the EMA of 100. The RSI is falling towards 50 level and the Stochastic is showing downward momentum. The MACD line is above the signal line in the positive territory. The ADX is not showing any clear signals.
The price may grow towards the upper Bollinger band at 1.25100 but the correction pattern is starting soon and sellers can expect 1.24000.
• DISCLAIMER: Please note that the above analysis is not an investment suggestion by “Capitalcore Ltd”. This post has been published only for educational purposes.