- May 10, 2022
- Category: Market News
The descending context might be ending
GBP/USD started a descending wave on the first of the Jun 2021 and the price line experienced almost 14% fall until 9th of May 2022, where lays a strong weakly support zone. Different indicators are showing the potential for a rend reversal on GBP/USD price line and a bullish wave might occur shortly.
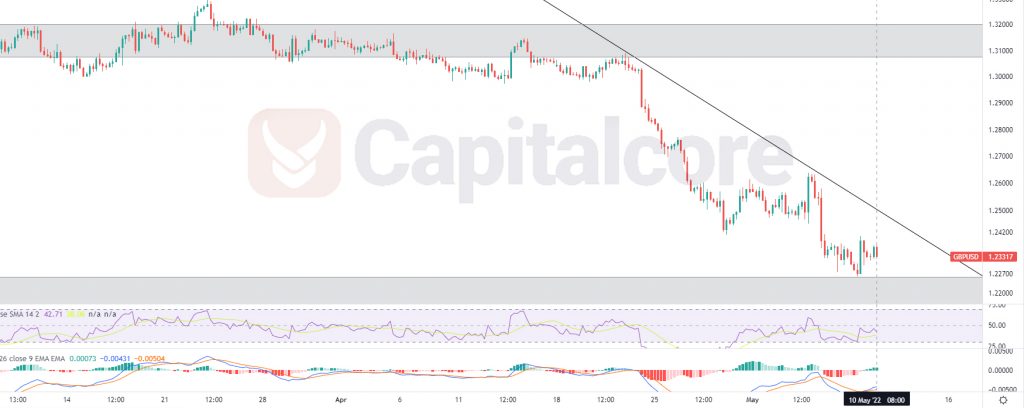
Chart Notes:
• Chart time-zone is UTC (+03:00)
• Candles’ time-frame is 4h.
On GBGP/USD price chart, the price line is showing 1.233 at the moment, where would be just above the weekly support zone which has been able to pump the price line several times in the past and therefore is considered as a strong zone. The descending black line on the chart, indicates the trend line that has formed the current bearish wave. The gray boxes are indicating the zones which are potential to reverse the trend when they encounter the price line. RSI is showing positive divergence and MACD is showing potential for an ascending wave. Traders can be waiting for the price line to break above the black line and then they can enter long positions on the retest of the trend line. Possible targets can be considered on 1.31 and 1.36, and if the bulls are powerful enough, the price can raise up to 1.42.
Please note that the above analyses would lose value if the price line breaks below the gray support zone majorly.
• DISCLAIMER: Please note that the above analysis is not an investment suggestion by “Capitalcore Ltd”. This post has been published only for educational purposes.