GBP/USD Market in an air of uncertainty
PMI Services and Composite PMI both came lower than expected in the UK. The market is volatile due to the US election so there is no rush to enter a position. On the chart, the price is oscillating, short trends are being formed and ruined rapidly.
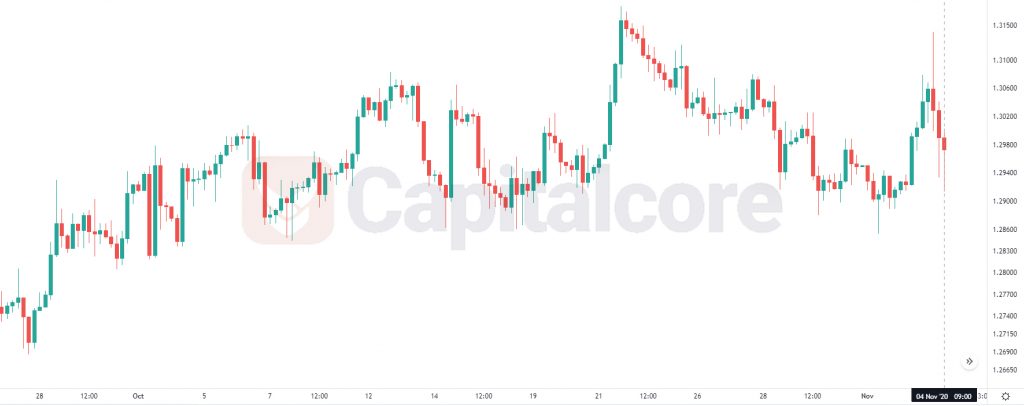
Chart Notes:
• Chart time-zone is UTC (+03:00)
• Candles’ time-frame is 4h.
The support rests at 1.28330 with resistance at 1.31130 which the weekly pivot point at 1.29710 is located in between the lines. The EMA of 10 is moving with bearish bias in the descendant channel and it is above the EMA 200 and the EMA of 100. The RSI is falling towards level 50 and the Stochastic is showing downward momentum. The MACD line is above the signal line in the positive territory. The ADX is showing buy signal.
GBPUSD is moving in a wide range. We cannot specify the trend direction. Reaching above 1.3000 can make buyers expect 1.31300. The decline can bring 1.28300 for sellers.
• DISCLAIMER: Please note that the above analysis is not an investment suggestion by “Capitalcore Ltd”. This post has been published only for educational purposes.