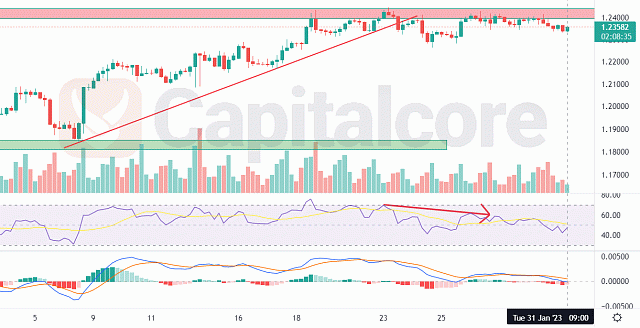
A trend reversal seems to be close
The GBP/USD price line started to rise on January 6, 2023. The value of the pair rallied nearly 5% in this trend until it hit a significant resistance level; after that, the positive slope of the histogram started to decrease and the bullish strength gradually decreases.

Chart Notes:
• Chart time-zone is UTC (+03:00)
• Candles’ time-frame is 4h.
1.23582 is the current price line on the GBP/USD price chart, slightly below the resistance area at 1.24000. Since the price line has made many reactions to the area, this resistance area, represented by the red box above the price line, is extremely important. The current bullish wave generating trend line is represented by the red ascending line. The strong support zone is represented by the green box below the price line, which can act as the ultimate target for the bears. With the RSI showing a negative divergence and the MACD having a bearish crossover, both the RSI and the MACD are sending bearish signals. Traders can expect a bearish wave heading to the support levels at 1.22000 and 1.21118.
• DISCLAIMER: Please note that the above analysis is not an investment suggestion by “Capitalcore Ltd”. This post has been published only for educational purposes.