Ascending signals have been issued
The price line on USD/GBP price chart, started a descending wave on 11th of June 2021, while the price was falling, a descending channel was formed. The price line descended about 8.45% until 14th of March 2022, and then a smooth ascending wave was formed; currently the price line is potential to go through an ascending wave.
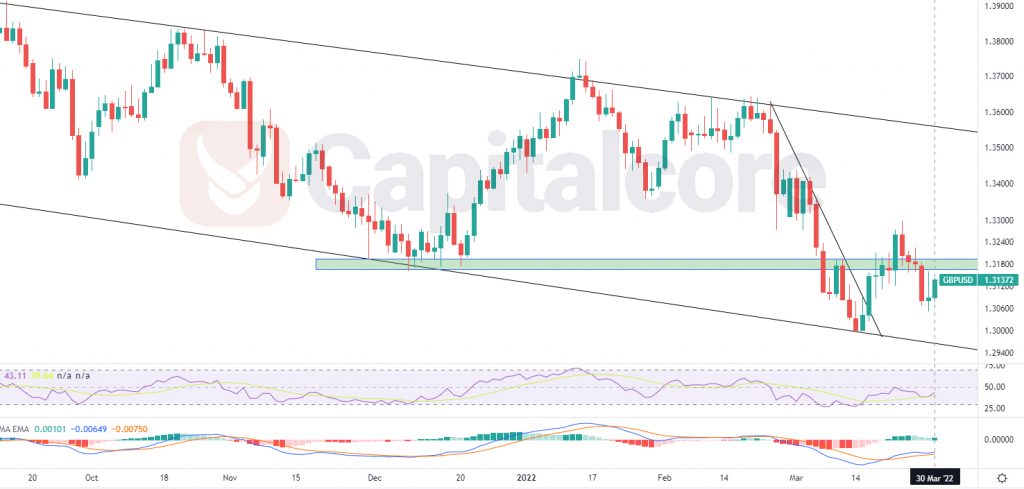
Chart Notes:
• Chart time-zone is UTC (+03:00)
• Candles’ time-frame is daiy.
The price line is currently on 1.31372. There is a level on 1.3163 – 1.31956 which would be a critical spot for the price line to break before entering a strong ascending wave. The black line on the price line indicates the trend line within which the previous descending wave occurred. The descending channel has also been shown by two black lines. RSI is almost on 43 and MACD is showing potential for an ascending wave to occur. Buyers can be waiting for the price line to break above the green area on the chart and on the retest of this area, they can enter long positions heading to 1.345 and 1.38 after that.
• DISCLAIMER: Please note that the above analysis is not an investment suggestion by “Capitalcore Ltd”. This post has been published only for educational purposes.