The price line couldn't break above the mid line
GBP/USD has started a down trend within a channel since 1st of Jun 2021. multiple reactions has been made to both top and base line of the channel. The final wave that the price line has been through was a descending line starting from the base line of the chart; bulls power could not overpass the mid line of the channel.
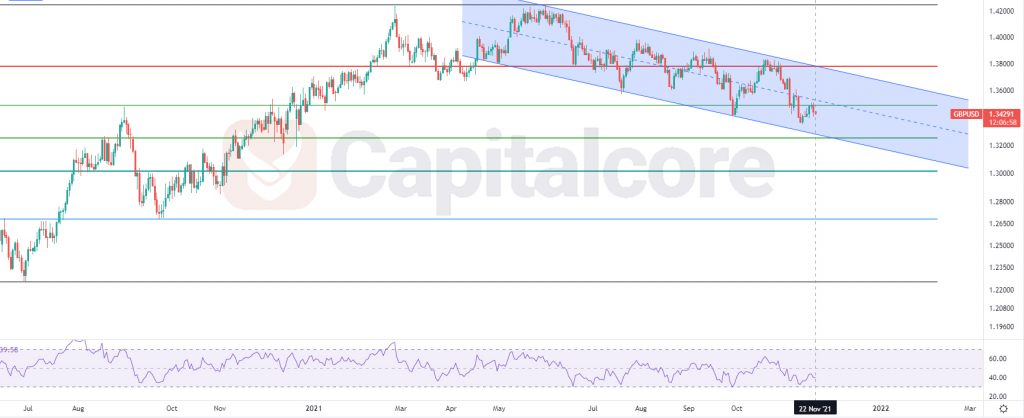
Chart Notes:
• Chart time-zone is UTC (+03:00)
• Candles’ time-frame is daily.
GBP/USD price right now is about 1.3438 and below level 0.382 of the Fibonacci retracement. There is a strong resistance above the price at 1.3494 which equals to 0.382 of the Fibo retracement as well as mid line of the channel. The resistance level looks too hard to be broken. Sellers can be waiting for a descending wave heading to the base line of the channel at 1.3257 which is also the next level of the Fibonacci retracement. As it is predicted, the next descending wave would be the last one of this bearish wave. please consider that breaking above 1.35 at any point would reduce the chance of a descending wave.
• DISCLAIMER: Please note that the above analysis is not an investment suggestion by “Capitalcore Ltd”. This post has been published only for educational purposes.