After a period of sharp moves, GBP/USD chart seems to be resting for a while
There are no major economic reports in the US but the UK will publish Claimant Count Change, Claimant Count Rate and Average Earnings Index. The price chart is on a ranged area and price moves smoothly, the next sharp trend of price might form after a ranging phase, which we believe takes the control of the price in the next few days.
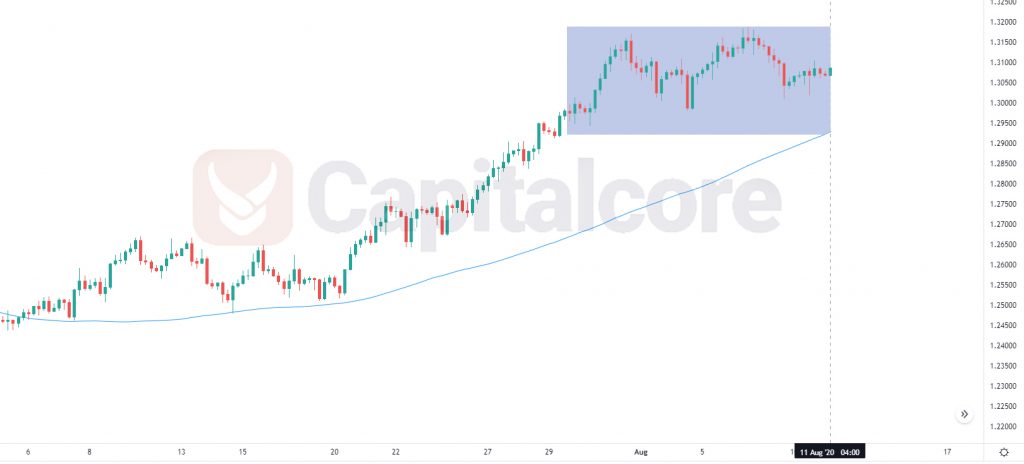
Chart Notes:
• Chart time-zone is UTC (+03:00)
• Candles’ time-frame is 4h.
The support rests at 1.30340 with resistance at 1.31210 which the weekly pivot point at 1.30740 is located in between the lines. The EMA of 10 is moving horizontally in the ascendant channel and it is above the EMA of 200 and the EMA of 100. The RSI is moving on level 50, the Stochastic is moving in high ranges and the MACD line is below the signal line in the negative territory. The ADX is not showing any clear signals.
GBPUSD will be fluctuating within the colored area.
• DISCLAIMER: Please note that the above analysis is not an investment suggestion by “Capitalcore Ltd”. This post has been published only for educational purposes.