- April 7, 2021
- Category: Market News
Head and shoulders pattern formed, what's next?
Pound bears dragged the price down without any specific reasons, the market was quiet yesterday and there were no influential events. Meanwhile head and shoulder pattern formed on the price chart, descending trendline is still valid and no buying signals has been issued.
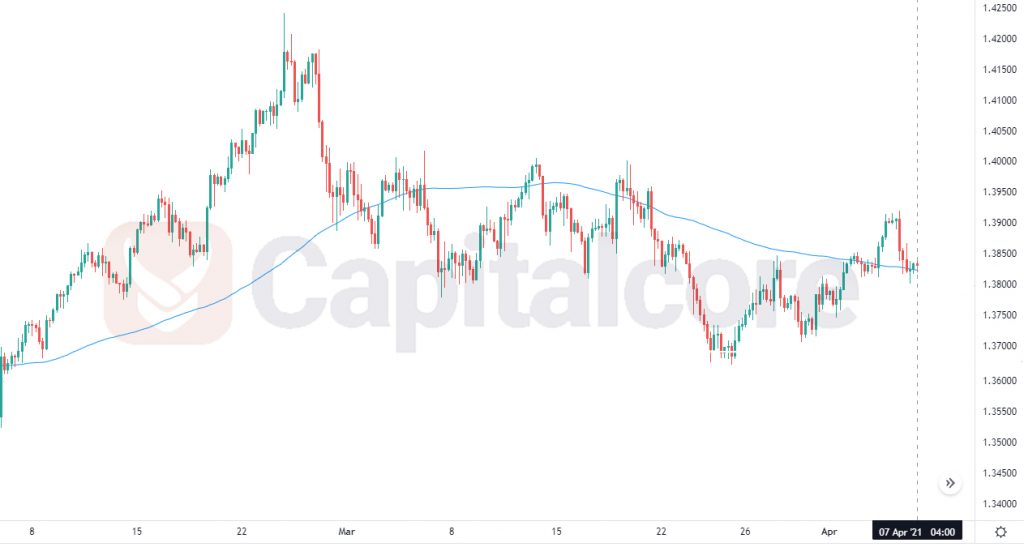
Chart Notes:
• Chart time-zone is UTC (+03:00)
• Candles’ time-frame is 4h.
The support rests at 1.37330 with resistance at 1.38610. The weekly pivot point at 1.37970 is located in between the lines. The EMA of 10 is moving with bearish bias in the descendant channel and it is above the EMA of 200 and the EMA of 100. The Stochastic is moving in low ranges, the RSI is moving in oversold area and the ADX is showing sell signal. The MACD indicator is in negative territory.
The resistance line seems too strong to be broken. The bearish trend will resume targeting 1.37000.
• DISCLAIMER: Please note that the above analysis is not an investment suggestion by “Capitalcore Ltd”. This post has been published only for educational purposes.