Is Cable Ready for a Breakout?
GBP/USD, often referred to as “Cable” in the forex market, represents the exchange rate between the British Pound and the US Dollar. This pair is one of the most traded in the forex market, known for its volatility and strong reactions to economic news. On the H4 chart, GBP/USD has completed a bullish wave but entered a correction phase as it approached a key resistance level. The pair is now retesting this resistance, and traders should carefully monitor the price action to detect any breakout of the current bearish structure. A breakout could signal the end of the correction and a potential continuation of the bullish trend, presenting an opportunity for long trades.
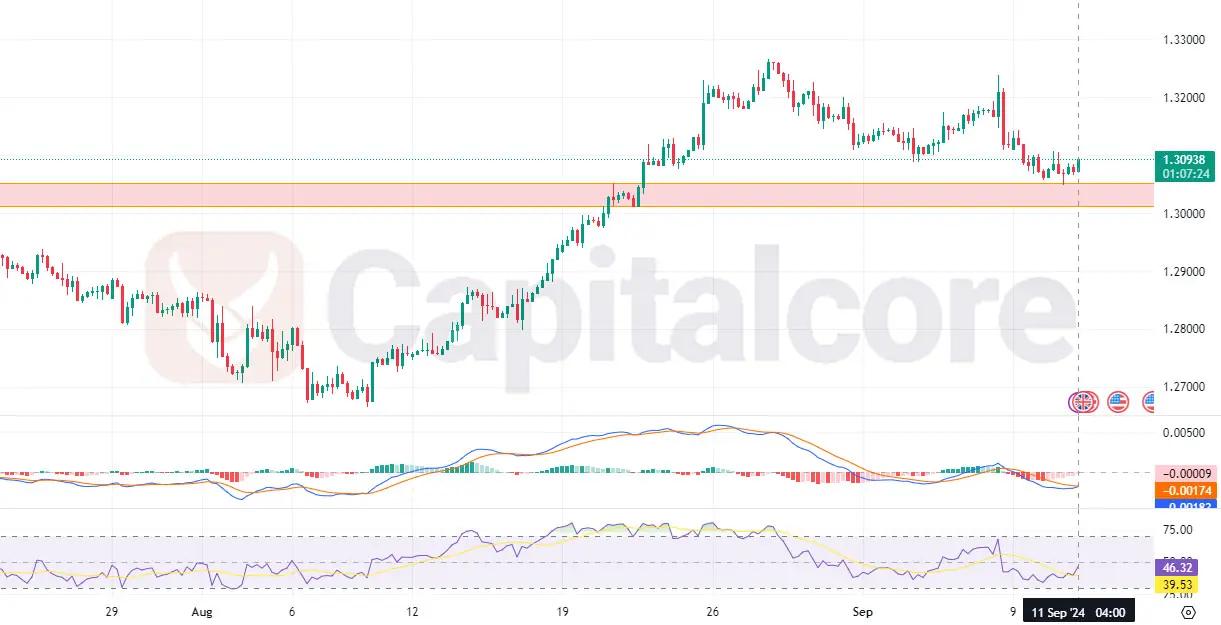
Chart Notes:
• Chart time-zone is UTC (+03:00)
• Candles’ time-frame is 4h.
The technical indicators are giving mixed signals. The MACD histogram is showing weakness, which suggests a loss of bullish momentum. However, the RSI indicates a bullish divergence, a sign that the correction might be losing steam. This divergence could be an early signal of a reversal, hinting at the potential for the bulls to regain control. Traders should keep a close watch on how the price behaves around the resistance zone, with a breakout above signaling a possible entry for long positions.
• DISCLAIMER: Please note that the above analysis is not an investment suggestion by “Capitalcore Ltd”. This post has been published only for educational purposes.