Downtrend Alert: USD/JPY Analysis
The USD/JPY pair currently exhibits bearish signals in the context of the Ichimoku Cloud. The fact that the last cloud is red and the price candles are positioned below the cloud indicates a strong downtrend. This is further corroborated by the position of the conversion line and the base line, which are both above the candles. In Ichimoku analysis, such a configuration typically suggests that the bearish momentum is strong and could persist. Traders might interpret this as a signal to consider short positions, as the market sentiment is tilted towards a bearish outlook for the USD/JPY pair.
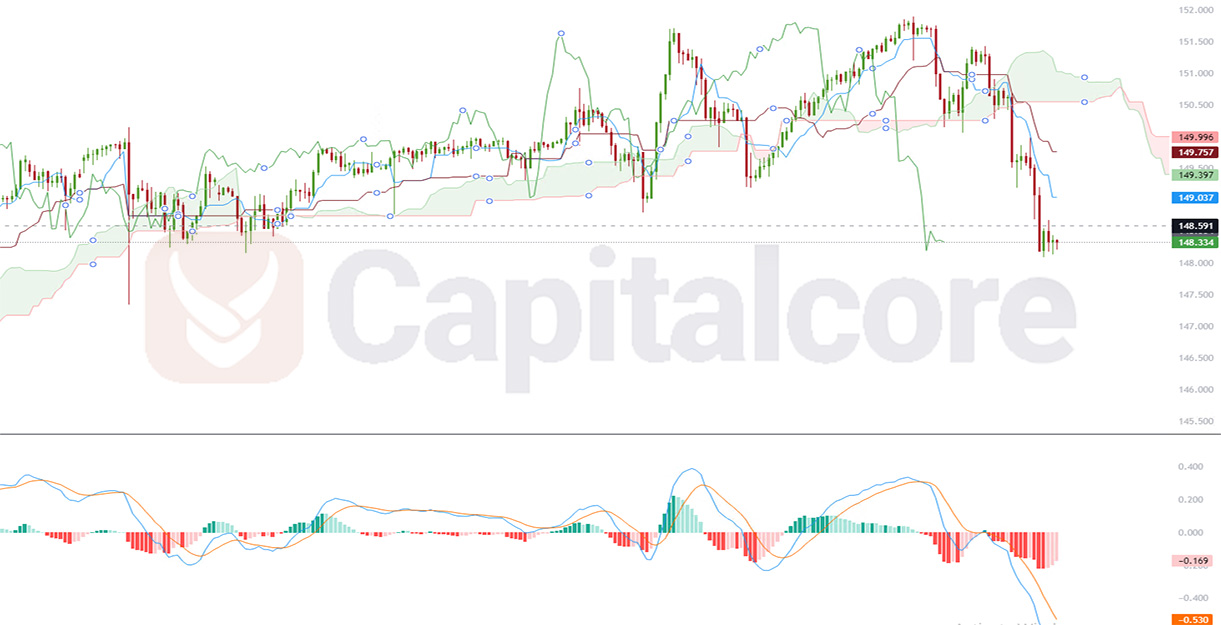
Chart Notes:
• Chart time-zone is UTC (+03:00)
• Candles’ time-frame is 4h.
Complementing the Ichimoku analysis, the MACD (Moving Average Convergence Divergence) indicator provides additional insights into the market’s momentum. The presence of red bars in the MACD histogram indicates a bearish market trend. Moreover, the MACD line and the signal line being below the histogram reinforce this bearish sentiment. This setup usually suggests that the downward momentum is gaining strength, and there might be further decline in the pair’s value. Traders using MACD as part of their strategy might see this as a confirmation of a bearish trend, supporting decisions for potential short trades or for staying out of long positions in the current market phase.
• DISCLAIMER: Please note that the above analysis is not an investment suggestion by “Capitalcore Ltd”. This post has been published only for educational purposes.