- Posted By: Lewis Miller
- Category: Market News
Shifts in GBPAUD: Assessing Recent Trend Changes
In the world of GBPAUD trading, a nuanced picture emerges. While the overall trend remains bullish, recent developments hint at a potential shift. Let’s delve into the details.

Chart Notes:
• Chart time-zone is UTC (+03:00)
• Candles’ time-frame is 4h.
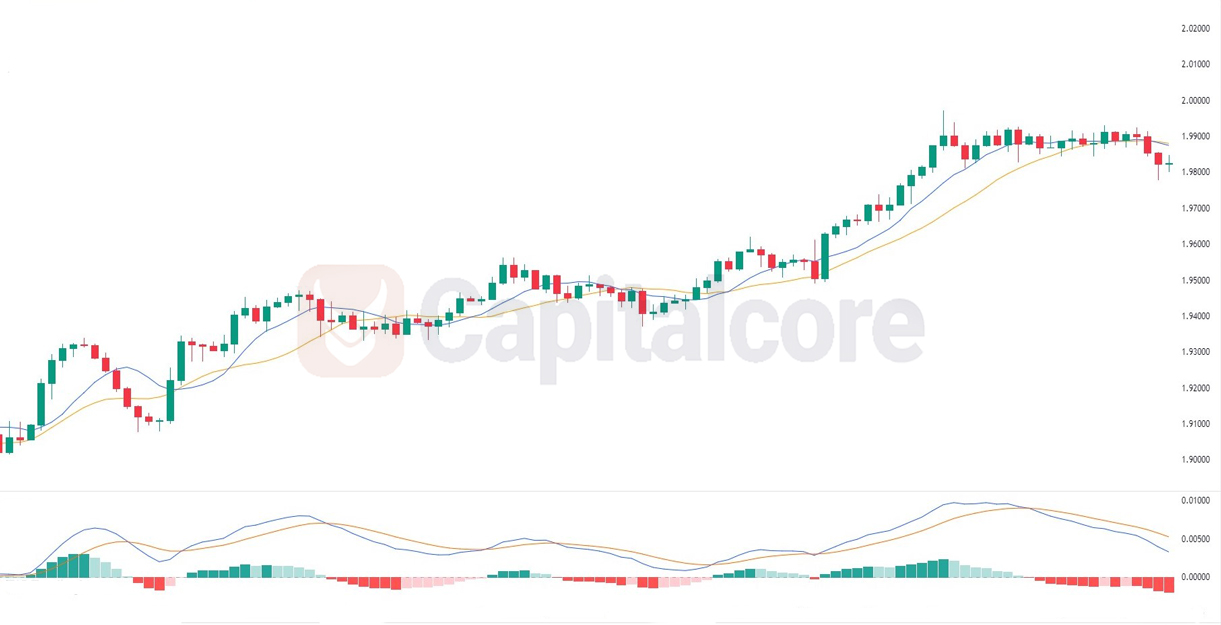
GBPAUD has exhibited an overarching bullish trend, though the recent emergence of three consecutive bearish candles denotes a gradual shift in sentiment. The histogram of the MACD indicator accentuates this shift, with the length of red bars growing, suggesting increased downward momentum. While the broader bullish trend remains a backdrop, traders should acknowledge the evolving bearish momentum indicated by recent price action and the strengthening histogram. Monitoring for potential confirmation of this trend reversal through additional candle patterns or momentum indicators would be prudent before making trading decisions. Adapting to changing market dynamics is key in aligning strategies with evolving trends.
• DISCLAIMER: Please note that the above analysis is not an investment suggestion by “Capitalcore Ltd”. This post has been published only for educational purposes.