Downward Dance: GBPAUD’s Technical Tale
The GBPAUD currency pair is currently treading on bearish terrain, with technical indicators signaling potential downside momentum. As traders monitor this pivotal shift, several key themes emerge.
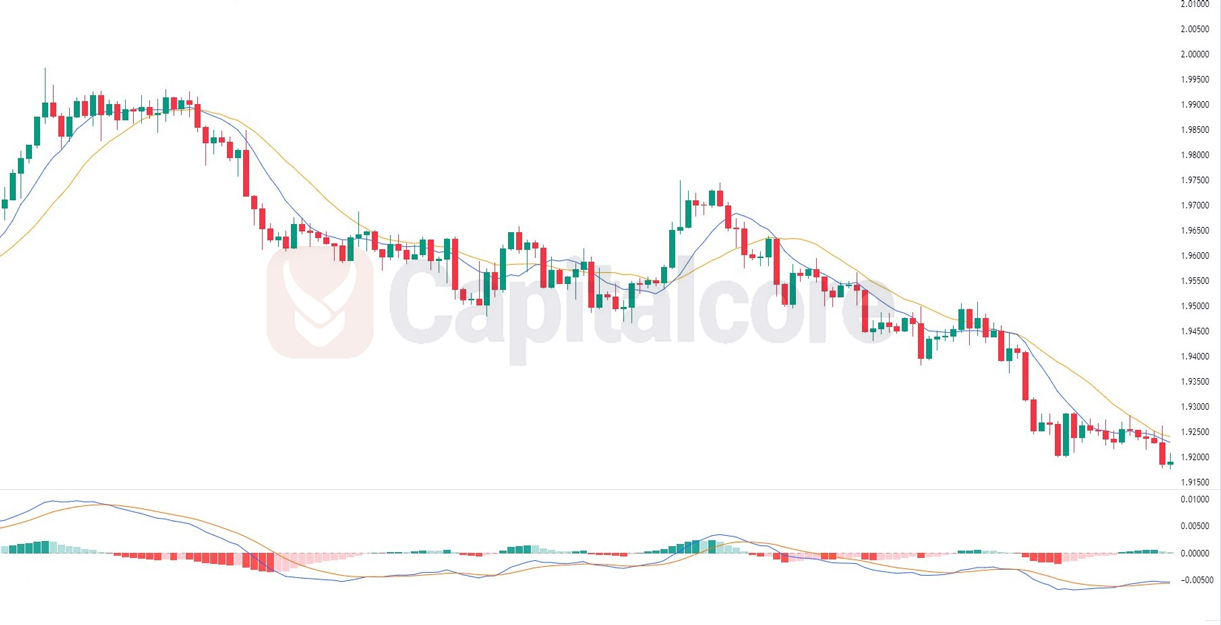
Chart Notes:
• Chart time-zone is UTC (+03:00)
• Candles’ time-frame is 4h.
The GBPAUD on its current chart exhibits a bearish inclination. The shorter SMA crossing below the longer SMA signifies a potential shift in momentum to the downside, a traditional bearish signal in technical analysis. Meanwhile, the MACD, another momentum oscillator, has its bars hovering around the zero line. This indicates a balance between buying and selling pressures but, when combined with the bearish SMA crossover, could be interpreted as a precursor to further downward momentum. The overall bearish trend suggests traders should be wary of potential declines. However, as with any technical setup, monitoring other key levels, fundamentals, and potential news events affecting the GBP and AUD will be crucial to validate or refute this bearish outlook.
• DISCLAIMER: Please note that the above analysis is not an investment suggestion by “Capitalcore Ltd”. This post has been published only for educational purposes.