- August 27, 2019
- Category: Market News
A retest of previous support or a strong bullish move?
GBP/CAD broke out of the descending trendline that it started to make at 6th of may and grew up to 1.636 then reacted to 0.236 level of the Fibonacci retracement and now is on a currently formed descending rally. We believe this is a very critical spot for GBP/USD price, as the support level at 1.588- 1.598 is partly close to the price and on the other hand an importance resistance level at about 1.632 is preventing the price from getting higher.
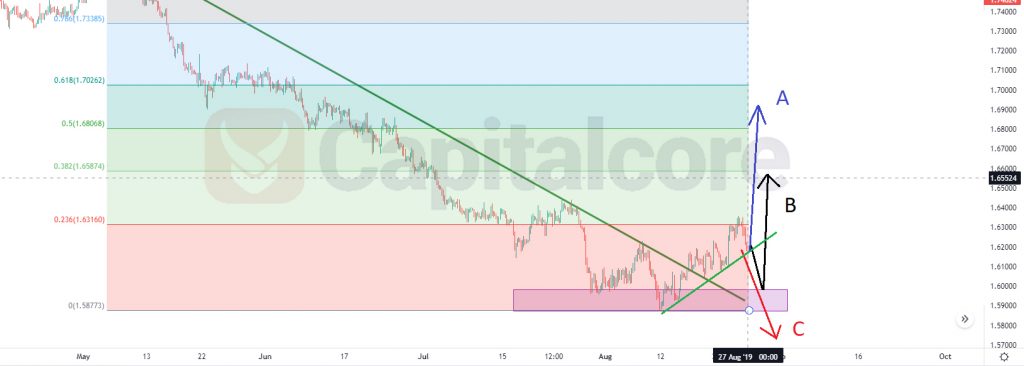
Chart Notes:
• Chart time-zone is UTC (+03:00)
• Candles’ time-frame is 4h.
So based on what we can see on the chart, there are three possible outcomes for GBP/CADchart in the next few days:
• A:right now the price is on a very recently formed ascending trendline; although the trendline looks very fragile, it still is possible for price to react to this area and continues the uptrend. the destination of this growth would be around 1.7 which is the 0.618 level of the Fibonacci retracement.
• B: in case the ascending trendline cant pump the price up, the next support level is at 1.6 -1.588 , so we expect the price to get pumped at around 1.6 and then continue the growth up to 1.66 which is 0.382 of the Fibo retracement. and in case this resistance cannot stop the uptrend, the next strong resistance to which the price may rich out, is around 1.703.
• C: at any point, if the support at 1.588 cannot pump the price up, the ascending wave would continue to 1.536; As there is not any strong support level closer to that.
• DISCLAIMER: Please note that the above analysis is not an investment suggestion by “Capitalcore Ltd”. This post has been published only for educational purposes.