ETH Bearish Downtrend
The H4 chart for ETHUSD presents a bearish sentiment as evidenced by the recent positioning of the Parabolic SAR above the price candles, typically indicating a downward trend or potential sell signals. The Ichimoku Cloud further supports this outlook, as the price has breached the cloud downwards, suggesting a shift in momentum. The MACD histogram is showing increased bearish momentum as it moves below the signal line and diverges, further emphasizing the potential for continued downward price movement.
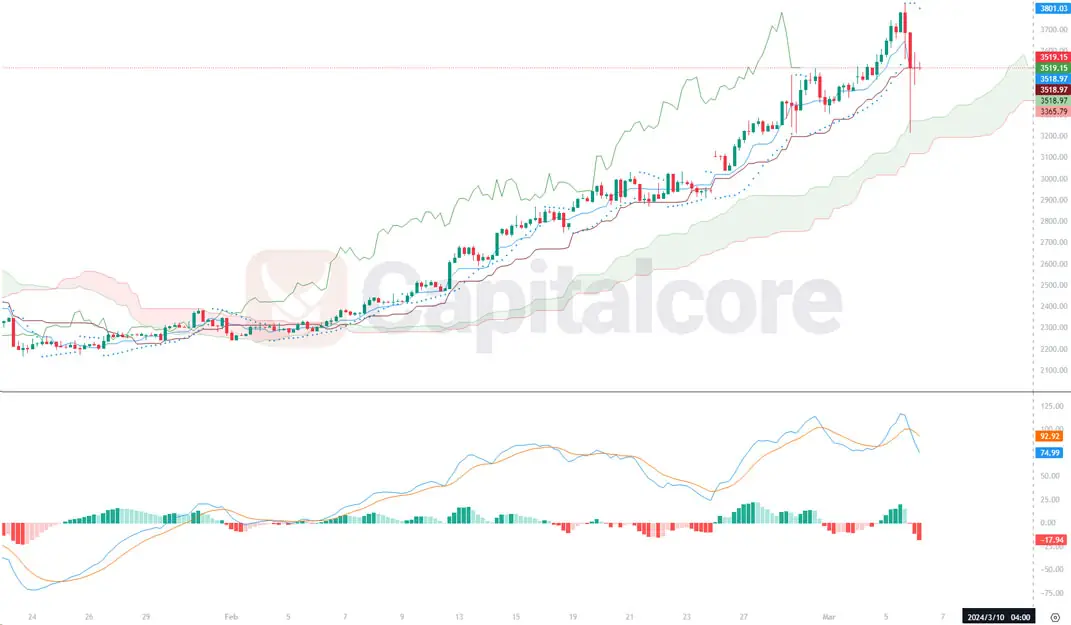
Chart Notes:
• Chart time-zone is UTC (+03:00)
• Candles’ time-frame is 4h.
Expanding on the analysis, the Ichimoku Cloud’s components should be examined to gauge future support and resistance levels. At this time, it appears that the price has moved below the baseline (Kijun-sen), which may act as a new resistance level. The Leading Span A (Senkou Span A) and Leading Span B (Senkou Span B) are diverging, increasing the cloud’s thickness, which may signal stronger resistance ahead. Conversely, the MACD’s declining histogram suggests that selling pressure is intensifying, and the recent crossover of the MACD line below the signal line typically confirms a bearish trend. Traders might consider waiting for a potential pullback to the cloud or baseline as a more favorable entry point for short positions. It is also crucial to watch for any flattening or upward tick in the MACD lines, which could precede a weakening of the bearish momentum or a potential reversal. As always, it’s recommended to use stop losses to manage risks, especially considering the volatility of cryptocurrency markets.
• DISCLAIMER: Please note that the above analysis is not an investment suggestion by “Capitalcore Ltd”. This post has been published only for educational purposes.