Riding the Bullish Wave: GBPCHF’s Rally Illustrated by Ichimoku and MACD
For the GBP/CHF currency pair chart provided, the technical analysis reveals a robust bullish trend. The price is comfortably situated above the Ichimoku Cloud, indicating that the market is currently in a strong uptrend. This is reinforced by the green cloud (or Kumo), which suggests a solid support base for the current trend, and the price maintaining its position above both the Tenkan-sen and Kijun-sen lines, which could be interpreted as additional bullish signals. Such a clear uptrend may be reflective of greater investor confidence in the British Pound compared to the Swiss Franc, possibly due to favorable economic news from the UK or diminishing appeal of the Franc as a safe-haven asset.
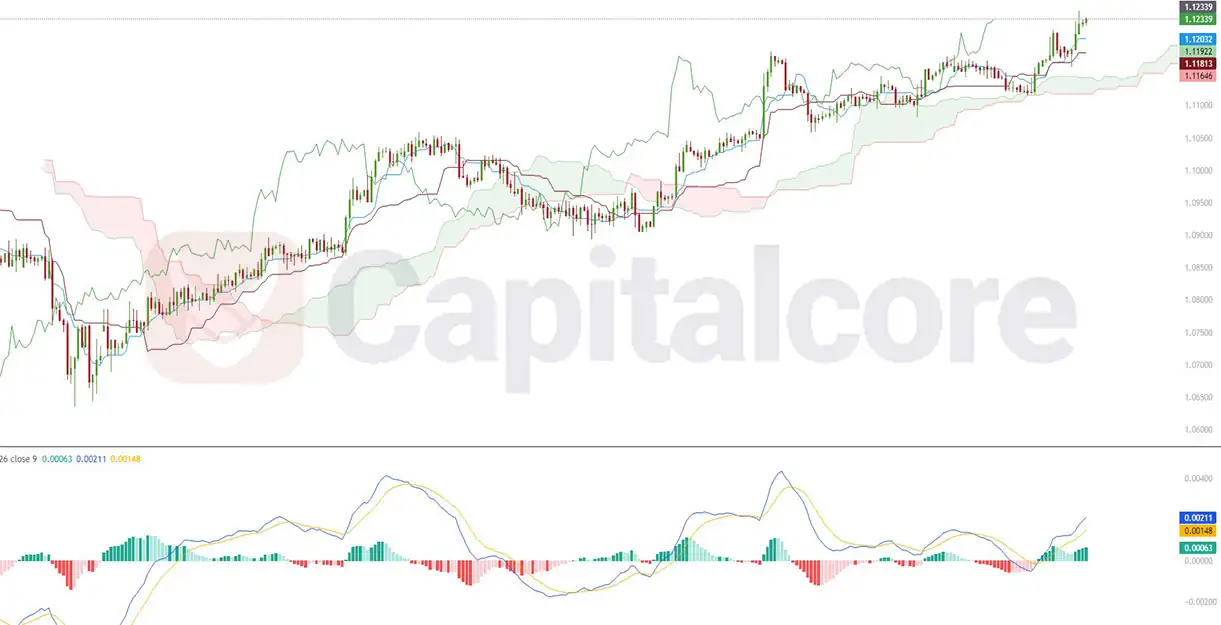
Chart Notes:
• Chart time-zone is UTC (+03:00)
• Candles’ time-frame is 4h.
The MACD indicator confirms this bullish momentum, with the MACD line positioned above the signal line and the histogram displaying increasing bullish bars. This indicates that the uptrend has strength and could persist. The separation between the MACD and signal lines further suggests that the bullish trend has vigor. Nevertheless, traders should be cautious and look out for any potential MACD line crossover below the signal line or a shrinking histogram, as these could signal a reversal or a pullback in the price. Given the GBP/CHF pair’s sensitivity to political and economic shifts between the UK and Switzerland, these technical indicators should be used in conjunction with current news events and market sentiment for a more comprehensive analysis.
• DISCLAIMER: Please note that the above analysis is not an investment suggestion by “Capitalcore Ltd”. This post has been published only for educational purposes.