- December 13, 2024
- Posted By: james w
- Category: Market News
GBPJPY Fundamental Analysis: Key Economic Data Driving Market Sentiment
The GBP/JPY forex pair, often referred to as the “Dragon” in the trading community, is a highly volatile cross-currency pair that does not include the US dollar. It combines the strength of the British pound (GBP) with the relative stability of the Japanese yen (JPY), offering unique opportunities for traders due to its sensitivity to risk sentiment and economic data from both the UK and Japan.
For today’s GBP/JPY news analysis, the GBP is under scrutiny with key releases, including consumer confidence (GfK), GDP growth, and manufacturing production, all of which provide insights into the economic health of the UK. Positive surprises in GDP growth and manufacturing output may strengthen the GBP, while weaker data could put downward pressure on the pair. Simultaneously, the JPY remains reactive to global risk sentiment and Japanese industrial production data. If risk aversion prevails, the JPY may see inflows, potentially pushing GBPJPY’s prices lower. Traders should carefully assess these releases, as their outcomes will significantly influence short-term price movements in the pair.

Chart Notes:
• Chart time-zone is UTC (+02:00)
• Candles’ time-frame is 4h.
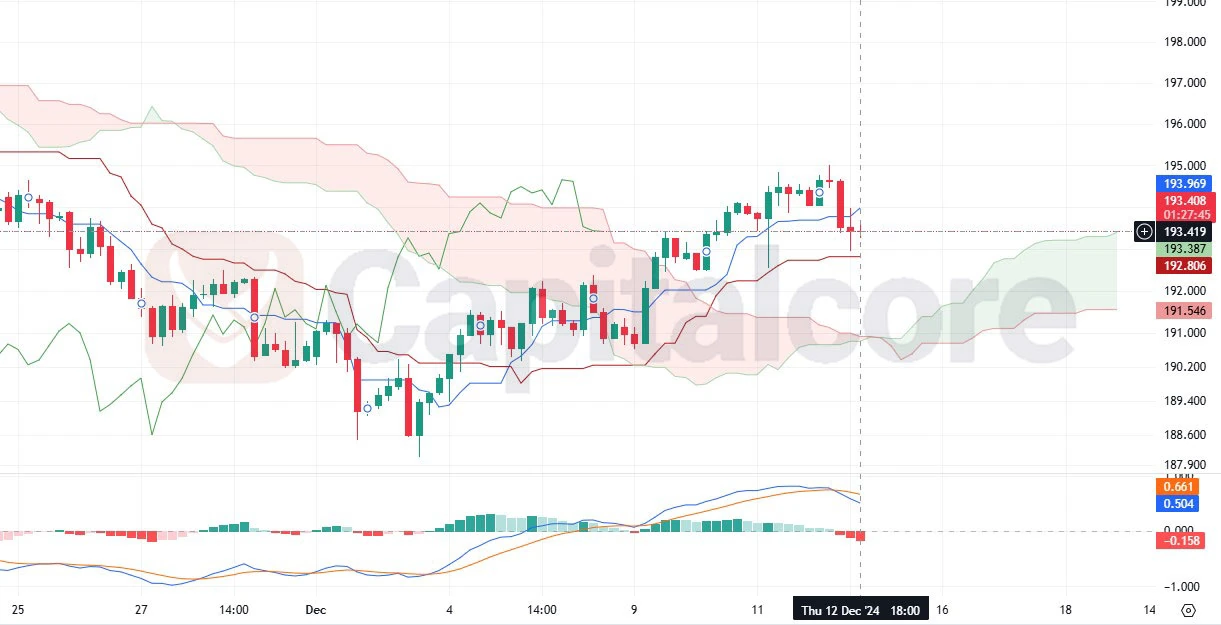
The H4 chart of GBP/JPY shows the pair trading near the Ichimoku Cloud, a critical area for gauging momentum and trend direction. Currently, the Dragon’s price action is attempting to break below the Tenkan-sen (blue line) and Kijun-sen (red line), signaling a potential GBPJPY bearish bias if confirmed. The Ichimoku Cloud itself acts as dynamic support and resistance, and the thin green cloud ahead suggests limited bullish momentum unless the pair finds support.
The pair’s technical analysis today with the MACD indicator reflects a bearish crossover with the MACD line dipping below the signal line, indicating increasing bearish momentum. Additionally, the histogram shows weakening bullish momentum as it moves closer to the zero line. This confluence of bearish indicators suggests the possibility of further downside movement unless strong support emerges near 192.50. Traders should monitor for a confirmed break below the Ichimoku Cloud for further bearish confirmation or a reversal signal for renewed bullish activity.
• DISCLAIMER: Please note that the above analysis is not an investment suggestion by “Capitalcore LLC”. This post has been published only for educational purposes.