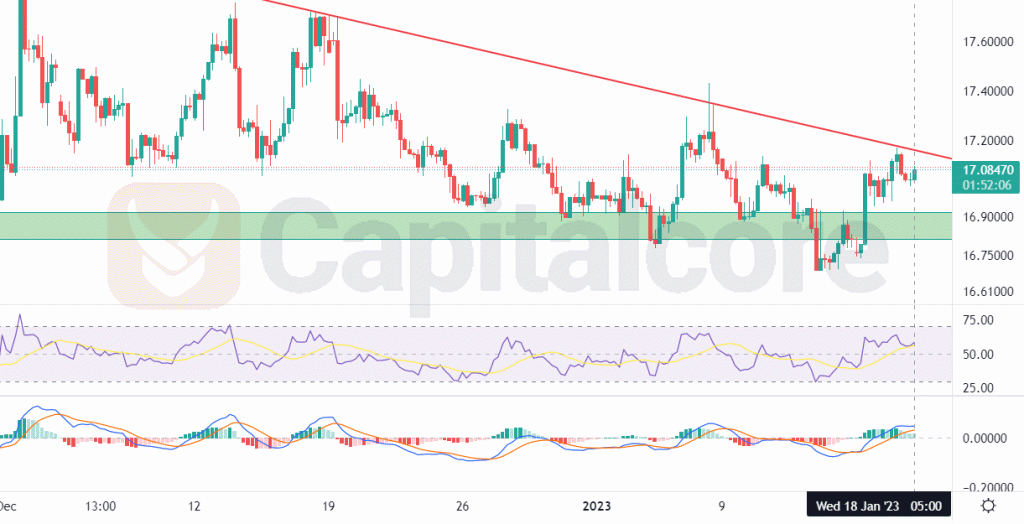
A descending triangle is formed on the chart
The price line on USD/ZAR price chart started moving bearishly on November the 3rd 2022. After several reactions to the static support zone at 16.8 – 16.9, a bearish triangle was formed on the chart. The price line swing oscillations largely reduced and a sharp wave could be expected after the price line breaks out of this triangle.

Chart Notes:
• Chart time-zone is UTC (+03:00)
• Candles’ time-frame is 4h.
The descending slope of the price line is majorly reduced and the oscillation range has been hardly limited. The price line is located just above the support zone at 16.8-16.9 . This zone has been demonstrated as a green box below the price line. The red descending line above the price line indicates the bearish trend line on the current downtrend of the price on this pair. Traders could expect a possible retest of the green zone, after the price line breaks above the trend line; there the bulls can enter long positions heading to the resistance level at 17.687 and 18.12740 after that.
• DISCLAIMER: Please note that the above analysis is not an investment suggestion by “Capitalcore Ltd”. This post has been published only for educational purposes.