RSI and Bollinger Bands in GBPUSD H4 Chart Analysis
The GBP/USD currency pair, commonly known as “Cable,” represents the exchange rate between the British pound and the US dollar. This pair is widely traded in the forex market due to the economic strength of both countries. Today’s GBP USD fundamental analysis hinges on key economic data from both the UK and the US, with particular attention to the Confederation of British Industry’s (CBI) Distributive Trades Survey for the UK and multiple reports from the US, including a speech by Federal Reserve Governor Lisa Cook and the release of key personal consumption and trade data.
Fundamentally, GBPUSD could see volatility driven by these news events. Positive UK CBI data may boost the pound if sales volumes are better than forecasted, signaling consumer strength in the British economy. In contrast, the US dollar could strengthen if Federal Reserve Governor Lisa Cook gives hawkish signals about future monetary policy, or if consumer spending and trade data exceed expectations. Traders will focus on both countries’ economic health, where strong US data could continue to support the dollar, while any weakness may allow the pound to rise against it, especially if UK retail figures outperform.
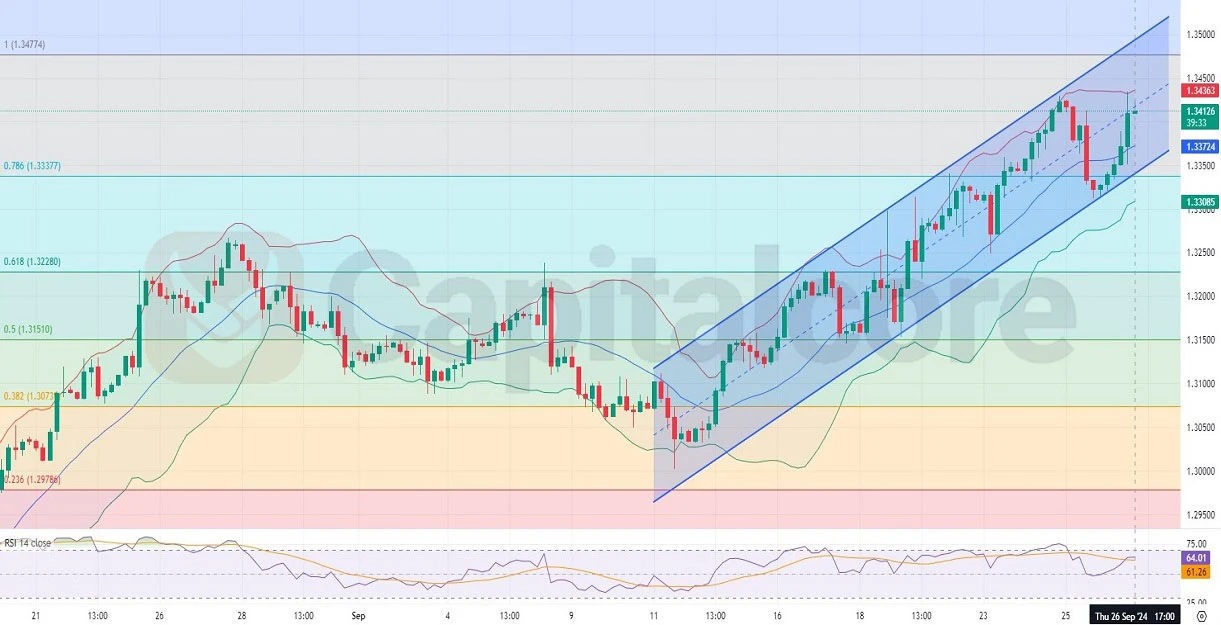
Chart Notes:
• Chart time-zone is UTC (+03:00)
• Candles’ time-frame is 4h.
In terms of technical analysis, the H4 chart for GBP/USD reveals a bullish trend. The price is moving within a rising channel and is positioned in the upper half of the Bollinger Bands, nearing the upper band, which often indicates strong bullish momentum. The price is also sitting between the 0.786 and 1 Fibonacci retracement levels, suggesting that it is approaching a critical resistance zone. Additionally, the RSI indicator shows the pair is not yet overbought but is approaching higher levels, suggesting that the bullish trend still has room to run before a potential reversal. Traders should watch for a breakout or rejection at these key Fibonacci levels, especially as fundamental news unfolds.
• DISCLAIMER: Please note that the above analysis is not an investment suggestion by “Capitalcore LLC”. This post has been published only for educational purposes.