Rising Momentum in GBPUSD H4 Bollinger and RSI Analysis
The GBPUSD pair, commonly known as “Cable,” is a significant forex pair that tracks the exchange rate between the British Pound and the US Dollar. It is a vital financial instrument for traders due to the economic prominence of both nations. Today, fundamental analysis must consider a slew of U.S. economic data including GDP, unemployment claims, and durable goods orders, alongside British economic releases like the BOE Financial Stability Report and BOE Governor Bailey’s speech. These factors could significantly influence Cable, with stronger-than-expected U.S. data potentially bolstering the USD, while hawkish remarks from Governor Bailey could lend strength to the GBP.
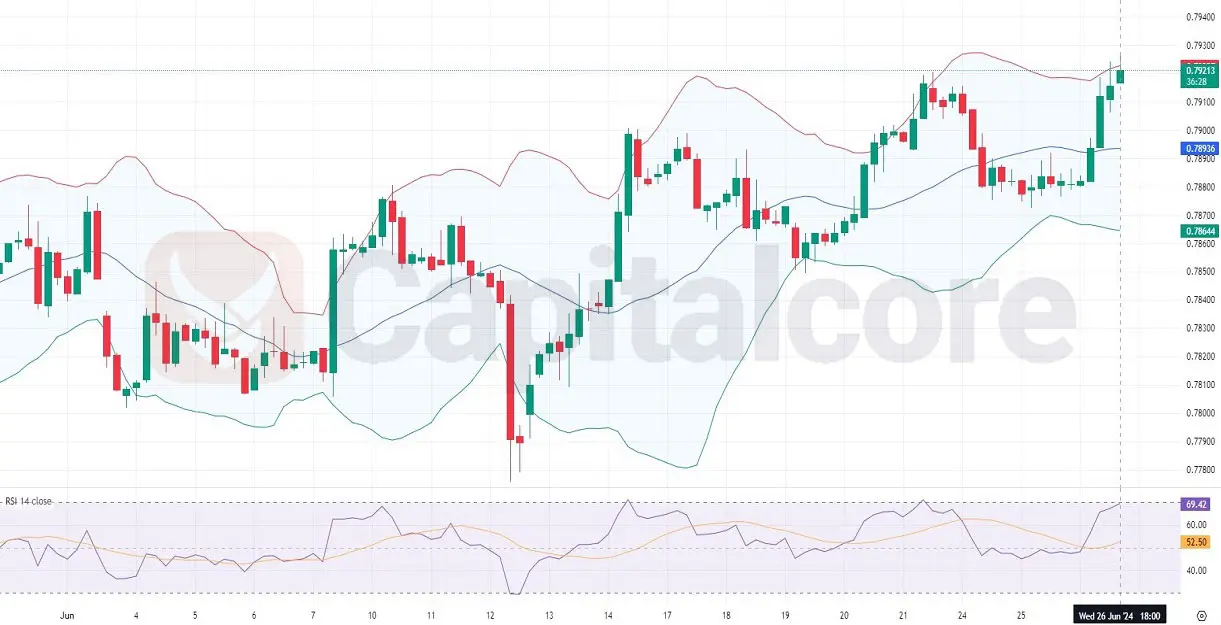
Chart Notes:
• Chart time-zone is UTC (+03:00)
• Candles’ time-frame is 4h.
Analyzing the uploaded GBPUSD H4 chart, the recent price action reveals a bullish trend. The last seven candles have shown a consistent bullish momentum, progressing from the lower Bollinger band toward the middle and surging past it to touch and currently flirt with the upper band. This movement is underscored by widening Bollinger bands, indicating increasing volatility and bullish strength in the market. The RSI, hovering near the 66 mark, suggests the market is approaching overbought territory but still has room before extreme levels, supporting the potential for continued bullish behavior in the short term.
• DISCLAIMER: Please note that the above analysis is not an investment suggestion by “Capitalcore Ltd”. This post has been published only for educational purposes.