- January 16, 2025
- Posted By: mia
- Category: Market News
GBPUSD Fibonacci Levels and Resistance Analysis
The GBPUSD, often referred to by its nickname “Cable,” is one of the most actively traded currency pairs in the forex market. It represents the exchange rate between the British Pound (GBP) and the United States Dollar (USD). Today’s upcoming news on UK RICS House Price Balance and UK GDP data, coupled with key USD figures like retail sales and jobless claims, can significantly influence the pair’s price movements. A positive GDP and RICS figure may signal economic resilience in the UK, boosting GBP strength, while stronger-than-expected US retail sales or a hawkish stance from the Fed President could drive USD gains. These opposing fundamentals suggest potential volatility, with traders keeping a close eye on the economic calendar.
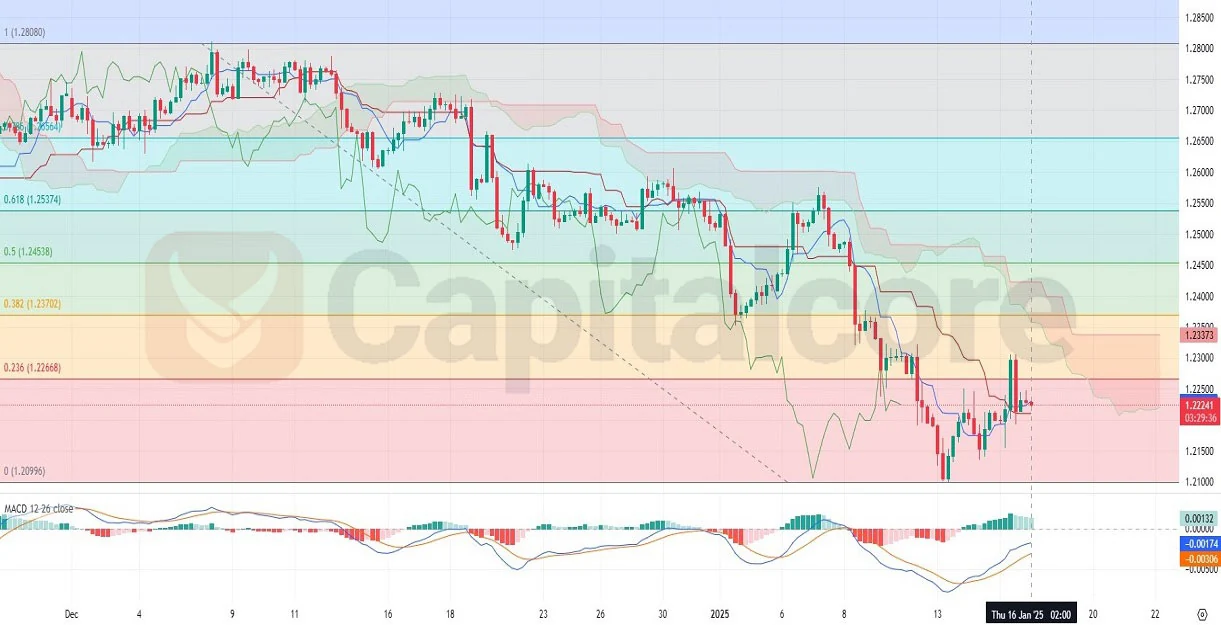
Chart Notes:
• Chart time-zone is UTC (+02:00)
• Candles’ time-frame is 4h.
From the uploaded H4 GBPUSD chart, the price action indicates a tentative bullish trend recovery but remains below the Ichimoku cloud and the 0.236 Fibonacci retracement level at 1.22668. The pair attempted to break this level but faced strong resistance, failing to maintain momentum above it. Indicators such as the MACD and histogram show divergence, with the histogram moving closer to the zero line but not yet signaling a confirmed reversal. The Ichimoku cloud acts as dynamic resistance, suggesting further consolidation or a potential retest of lower support levels before a decisive breakout occurs.
•DISCLAIMER: Please note that the above analysis is not an investment suggestion by “Capitalcore LLC”. This post has been published only for educational purposes.
