- Posted By: james w
- Category: Market News
Analyzing GBP/USD Bollinger Bands and Fibonacci Levels
The GBPUSD currency pair, known as the “Cable,” is one of the most actively traded pairs in the forex market, linking the British pound (GBP) with the US dollar (USD). Today, traders will closely monitor several key US data releases, including jobless claims, labor productivity, and unit labor costs, as well as inventory and mortgage data. Lower-than-expected unemployment claims and improved productivity figures may strengthen the dollar, making it harder for the pound to regain footing. Additionally, the Bank of England’s ongoing policy outlook and recent statements hint at possible rate stabilization, which may impact GBP demand. These releases, coupled with signals from Federal Reserve officials, could set a volatile trading environment for GBPUSD pair.

Chart Notes:
• Chart time-zone is UTC (+02:00)
• Candles’ time-frame is 4h.
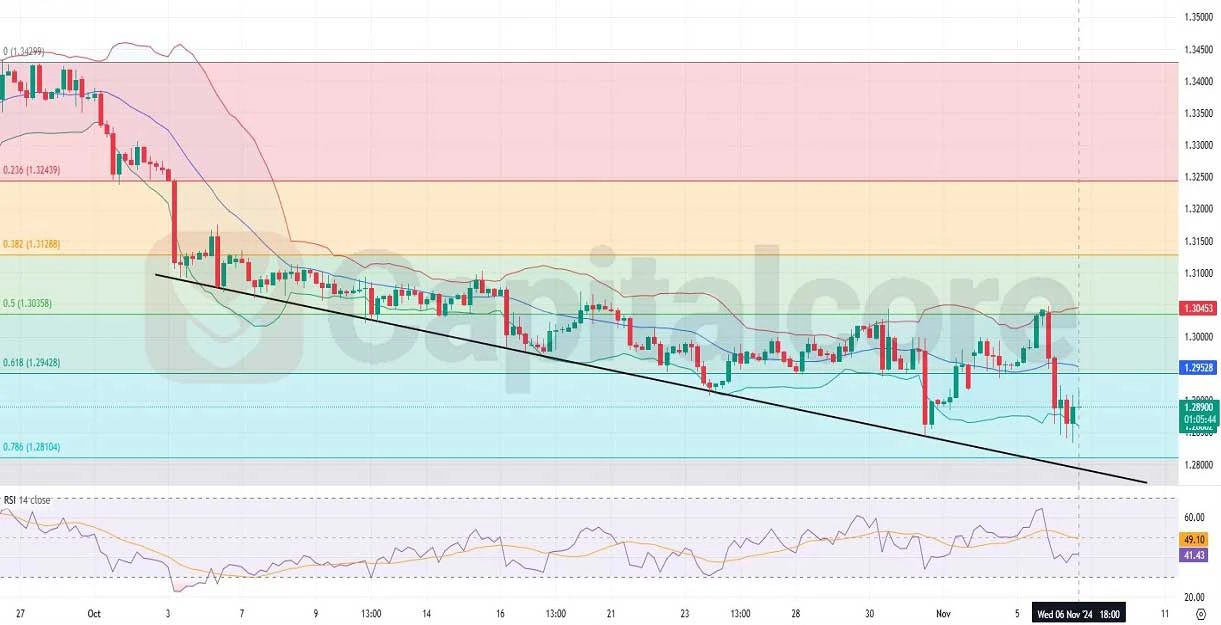
On the GBP USD H4 chart, the pair has exhibited a gradual downtrend over the past month, with bearish candles outweighing bullish ones, leading to a decline in price. Currently, GBP USD has moved from the upper Bollinger Band to the lower band, with recent strong bearish momentum marked by two solid red candles. After touching the lower band, the GBPUSD price has shown a slight rebound, supported by two bullish candles, indicating potential upward movement within the range of the lower and middle Bollinger Bands. The price currently lies between the 0.786 and 0.618 Fibonacci retracement levels, suggesting a possible support zone that could lead to a temporary recovery before a further move is confirmed by upcoming data releases.
•DISCLAIMER: Please note that the above analysis is not an investment suggestion by “Capitalcore LLC”. This post has been published only for educational purposes.