4-Hour Gold Outlook: Bullish Momentum Wanes
In the 4-hour timeframe analysis of Gold, we observe a market that has recently displayed signs of strength but now faces potential indications of a slowdown. With the RSI above 60 and the MACD green bars weakening, traders are presented with a critical juncture in which a bullish trend may be losing steam, warranting careful attention for potential shifts in the precious metal’s price dynamics.
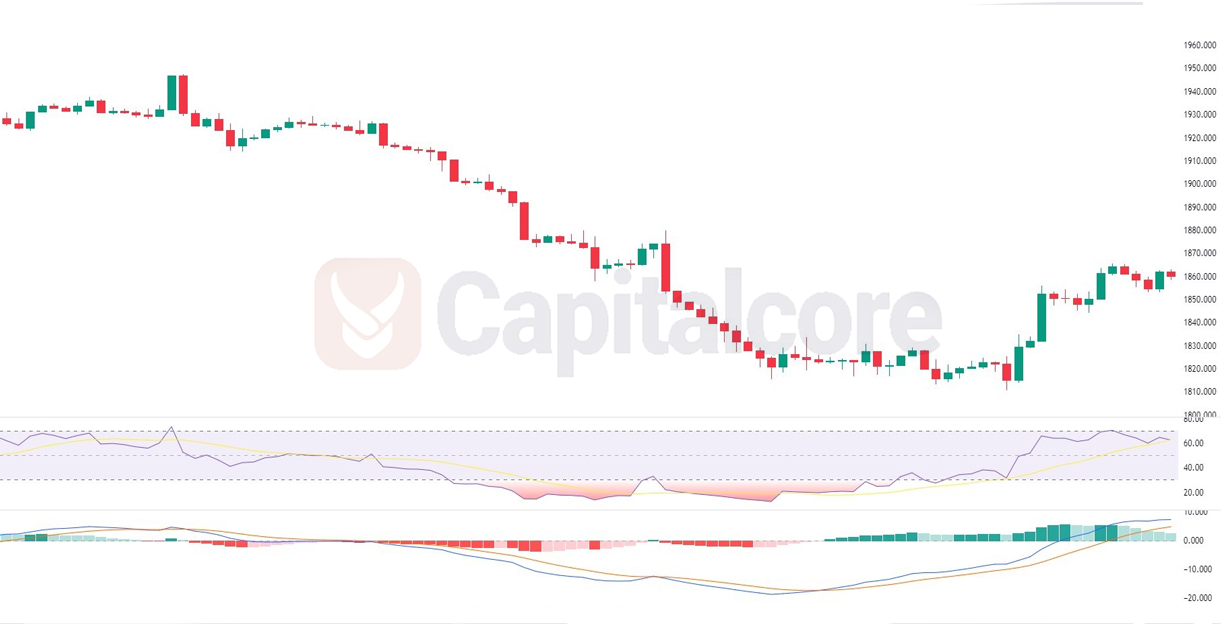
Chart Notes:
• Chart time-zone is UTC (+03:00)
• Candles’ time-frame is 4h.
On the 4-hour timeframe for Gold, there are some notable technical indicators to consider. Firstly, the Relative Strength Index (RSI) being above 60 suggests that Gold may be in overbought territory, potentially indicating a bullish trend losing some momentum. This elevated RSI could imply that the market is due for a correction or consolidation in the near term.
Additionally, the MACD (Moving Average Convergence Divergence) indicator showing decreasing green bars in terms of both color and strength indicates weakening bullish momentum. The diminishing green bars might signify a slowdown in the upward price movement or even the possibility of a bearish crossover.
Traders and investors should closely monitor these indicators along with other factors such as support and resistance levels to make informed decisions. It’s essential to be cautious as these signs could signal a potential shift in Gold’s short-term price direction, possibly towards a period of consolidation or even a corrective pullback.
• DISCLAIMER: Please note that the above analysis is not an investment suggestion by “Capitalcore Ltd”. This post has been published only for educational purposes.