Gold: Caution as Bearish Patterns Emerge
Gold is traditionally seen as a safe-haven asset and a hedge against inflation. Its price movements are a focal point for investors, especially during times of economic uncertainty. In this technical analysis, we will examine the latest trends and indicators to understand the potential direction of the market.
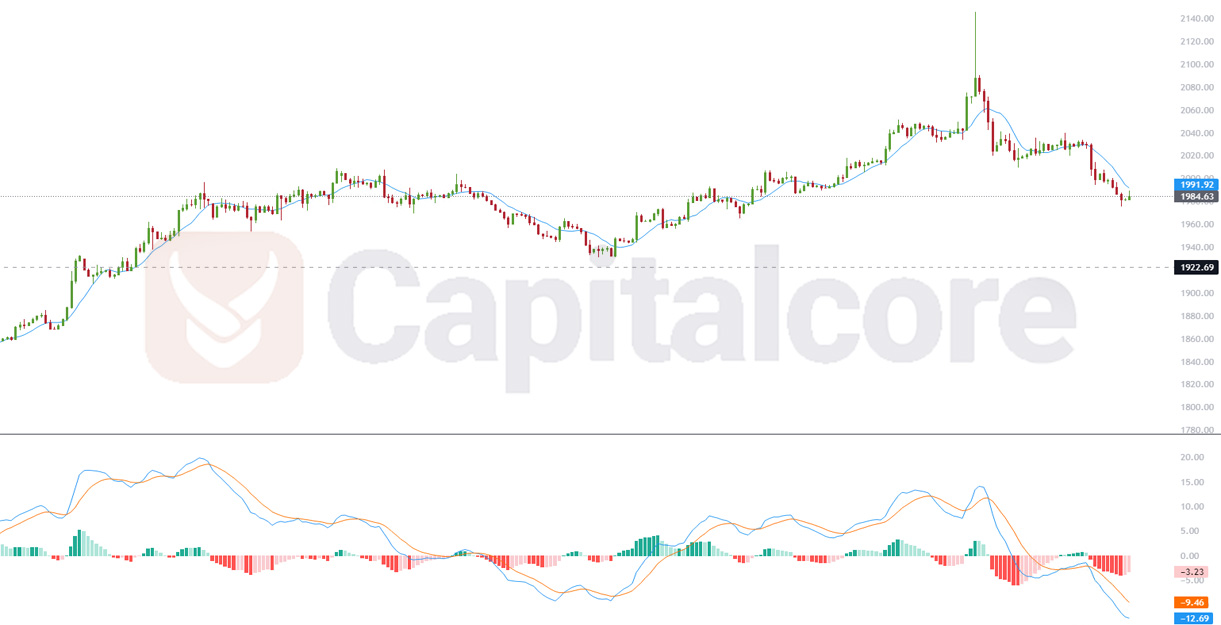
Chart Notes:
• Chart time-zone is UTC (+03:00)
• Candles’ time-frame is 4h.
On the 4-hour chart, Gold’s price has recently made a notable decline, moving sharply below the Moving Average (MA), which signals bearish momentum. The MA line itself is trending downwards, reinforcing the bearish outlook. The MACD indicator aligns with this sentiment, as the MACD line has crossed below the signal line, and the histogram bars are increasing in height below the zero line, indicating strengthening bearish momentum.
With the price currently below the MA and the MACD indicating a bearish trend, traders might exercise caution. The nearest support level appears to be at the $1922.69 mark, which, if broken, could lead to further declines. Resistance is now formed by the MA line, which the price would need to cross above to indicate a potential reversal of the current trend.
• DISCLAIMER: Please note that the above analysis is not an investment suggestion by “Capitalcore Ltd”. This post has been published only for educational purposes.