Bullish Cloud with Bearish MACD Divergence
Gold’s performance is often reflective of global economic stability and investor sentiment. As a preferred safe-haven asset, its price dynamics offer insights into market trends and inflationary pressures. The technical chart below provides a snapshot of gold’s current trading behavior and potential future movements.
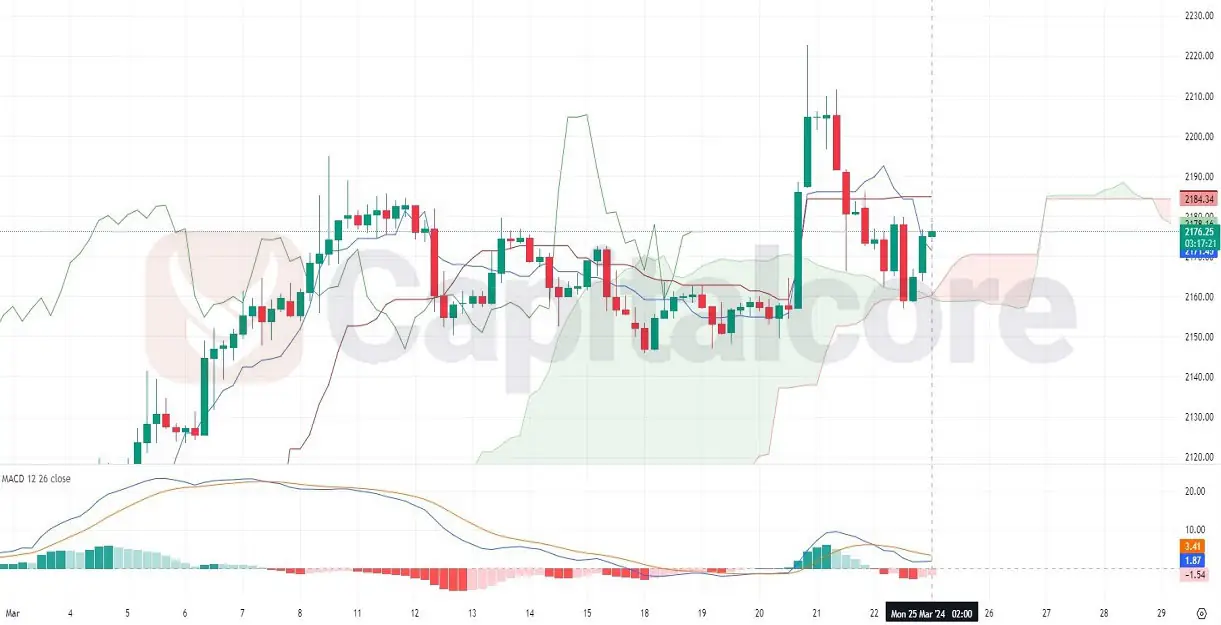
Chart Notes:
• Chart time-zone is UTC (+03:00)
• Candles’ time-frame is 4h.
The gold market, observed on a daily chart, shows a recent increase in volatility within a bullish Ichimoku cloud, indicating a potential trend continuation. After a sharp rise, the price has retreated, testing the cloud’s support, with the conversion line (blue) above the baseline (red), which traditionally suggests bullish conditions. However, the MACD is showing a bearish crossover with declining histogram bars, suggesting that momentum may be slowing. The Relative Strength Index (RSI) is not pictured, but such information would be vital for confirming momentum. Traders should watch if the price sustains above the Ichimoku cloud for bullish confirmation, whereas a break below could indicate a trend reversal. The upcoming candlesticks and MACD behavior will be critical for determining whether the bullish sentiment will prevail or if a correction is imminent.
• DISCLAIMER: Please note that the above analysis is not an investment suggestion by “Capitalcore Ltd”. This post has been published only for educational purposes.