A descending wave could be expected
The price line on Gold price chart, went through a sharp ascending wave by the close of the weekly candle. The current price on Gold price chart is right now frozen above its descending trend line and just below a resistance level. Some indicators are showing traders are over buying gold; and therefore a correction phase can be expected.
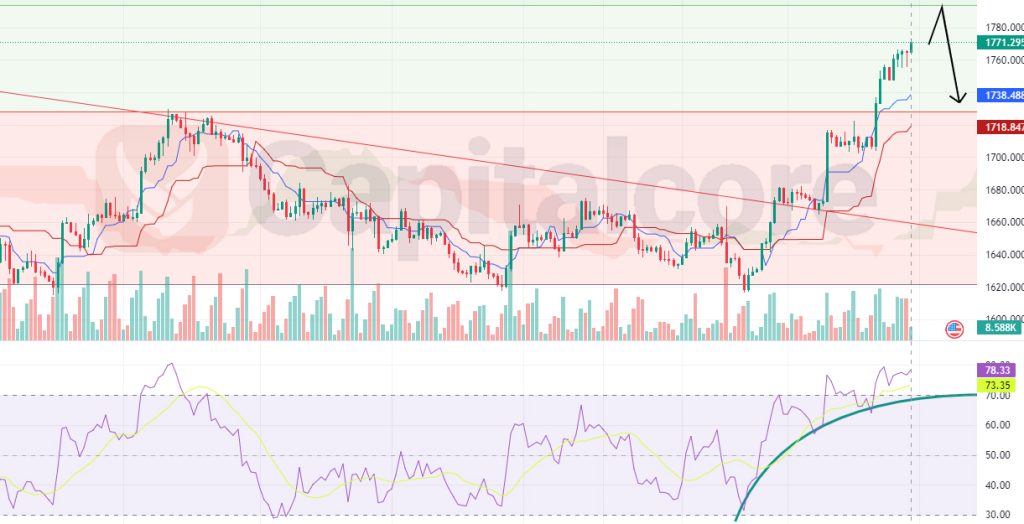
Chart Notes:
• Chart time-zone is UTC (+03:00)
• Candles’ time-frame is 4h.
The price line on Gold price chart is showing 1771.295; this area is placed above level 0.236 of the Fibonacci retracement on the previous descending wave, which is highlighted with light red. The descending trend line, which backed up the previous bearish wave and is reflected as a red descending wave, is broken and the price line is now heading towards level 0.382 of the Fibonacci retracement. RSI is showing overbuying in the market, indicating almost 80. Traders can expect the price to grow, until touching the Fibonacci level, there they can enter short positions. The target for the bulls can be considered on 1755.38 and 1670.00 after that. Also consider that, in case the price line breaks above the Fibonacci resistance at 1790, the validity of this analyze would be taken under question.
• DISCLAIMER: Please note that the above analysis is not an investment suggestion by “Capitalcore Ltd”. This post has been published only for educational purposes.