Ascending trend is still on going
The Gold market is moving high and above the EMA200 in Today’s trading session. The technical studies indicate a wide momentum in the Gold price. Candles in 4h time frame are showing buy pattern, base line of the channel has not been penetrated yet. The overall look of the chart is bullish.
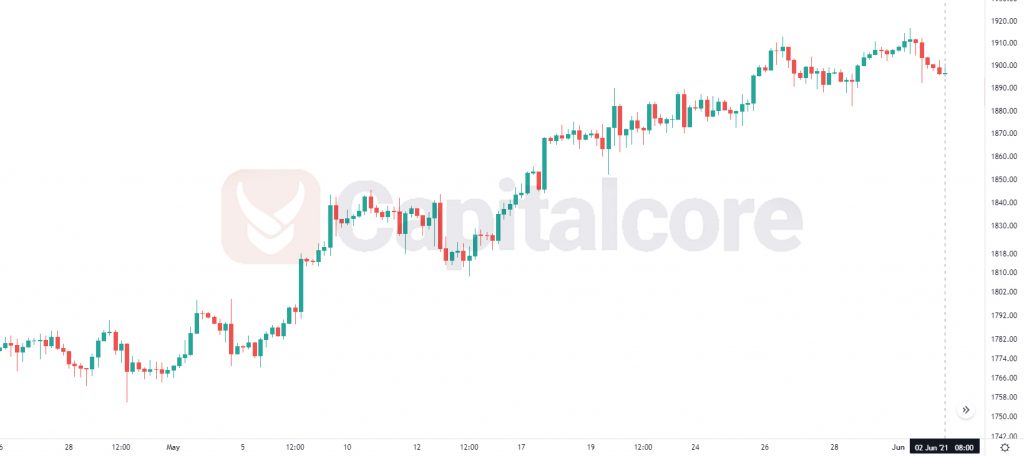
Chart Notes:
• Chart time-zone is UTC (+03:00)
• Candles’ time-frame is 4h.
The support rests at 0.72140 with resistance at 0.72340 which the Pivot Point at 0.72270 is located above the price line. The EMA of 10 is moving in bearish bias in descendant channel and it is above EMA of 200 and the EMA of 100. The RSI is moving in oversold area, the MACD histogram is in negative territory and is showing a sell signal. The Stochastic is moving in low ranges and the ADX is showing an upward momentum. The price is below the Ichimoku Cloud and the Chinkou Span is far way from the market price. The Tenkan-sen and the Kijun-sen are showing downward momentum.
• There is resistance at 0.72340, followed by resistance at 0.72470 and 0.72470.
• There is support at 0.72140 Below, there is 0.72070 and 0.71940.
• DISCLAIMER: Please note that the above analysis is not an investment suggestion by “Capitalcore Ltd”. This post has been published only for educational purposes.