A triangle is formed, the next move will be sharp
After a big growth that started in 16th of August 2018, XAU golden time sounds to be over! On 7th of August 2020 gold could record a new ATH and after that the price started a sideway range and formed a triangle. Right now the price line is pretty close to the base lane of the triangle.
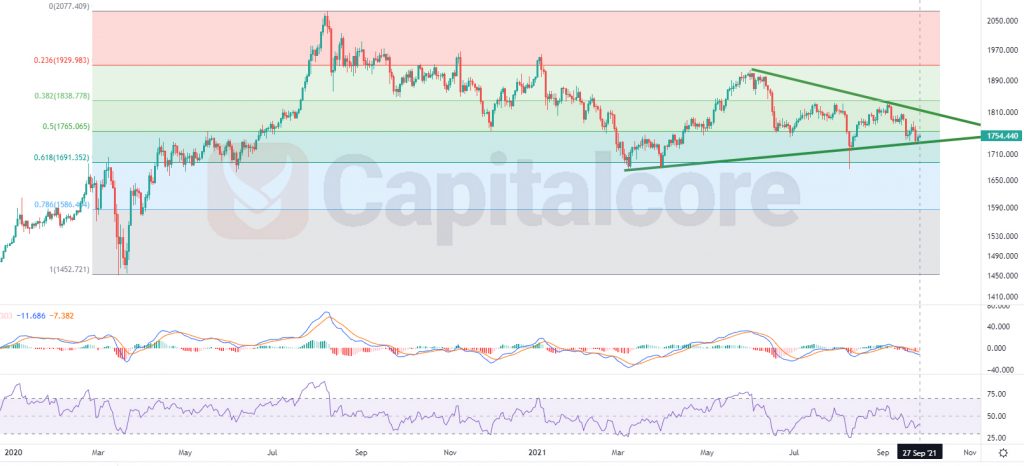
Chart Notes:
• Chart time-zone is UTC (+03:00)
• Candles’ time-frame is daily.
The price is expected to have a retest of the top of the ascending trendline, which is a very strong resistance at about 1840. Previously this resistance could push the price down several times and it is also level 0.382 of the Fibonacci retracement. After a retest of this area, the price is expected to fall to 1670- 1680, which is the strongest support around the current price as it has pumped the price up multiple times in the past and is also level 0.618 of Fibonacci retracement. In case this resistance is broken by the price line too, the next most possible goals the the ascending trend would be 1585 and 1455. On the other hand if the price tends to break the descending trendline and form a bullish trend, the most possible price that would be reached would be 1930. Also touching ATH or even going further will be possible.
• DISCLAIMER: Please note that the above analysis is not an investment suggestion by “Capitalcore Ltd”. This post has been published only for educational purposes.