- July 5, 2022
- Category: Market News
The price line is on a strong resistance
Gold price has been moving within a bearish trend line since 9th of March 2022, during which, the price line was able to only rise to touch the trend line a few times, but has never been able to break above it. Right now the price line is approaching the trend line once more, and after taking a bullish step, is looking bearish.
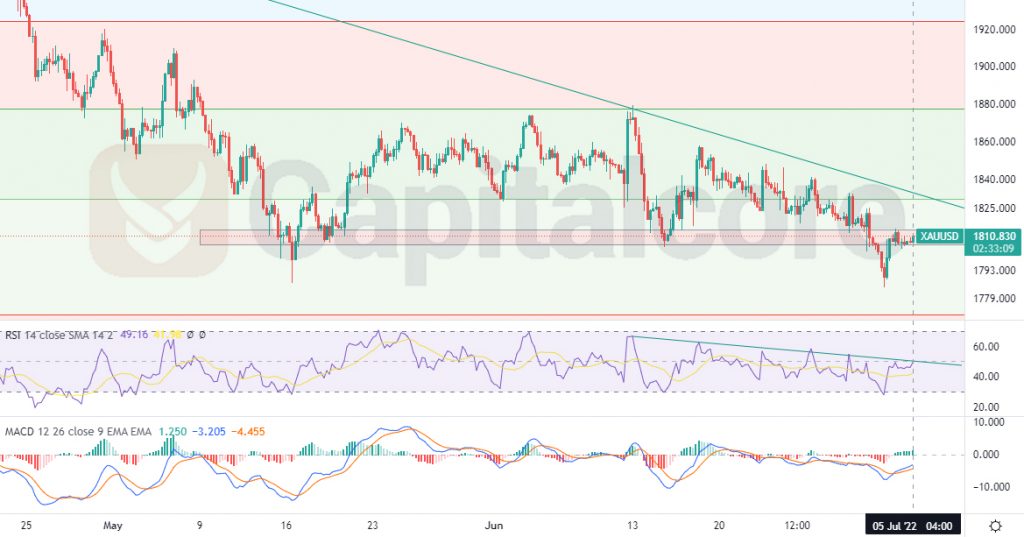
Chart Notes:
• Chart time-zone is UTC (+03:00)
• Candles’ time-frame is 4h.
The price line is currently on 1810 on Gold price chart. The area is inside a strong resistance, which has lately been formed on the chart and is indicated as a light red zone. The green descending line indicates the main descending trend line that started forming on 9th of March 2022. RSI is also on a resistance level, which has been shown as a green bearish line and it is currently showing almost 50. MACD is showing Bullish wave on going; but the ascending slope of the price line has largely decreased. Traders can be waiting for the price line to either break below the red zone or touch the descending trend line, then they can enter short positions heading to 1785; the second target point can be set on 1725.
Please note that, if the price line breaks above the green dynamic resistance, the chance would be more with bulls than the bears.
• DISCLAIMER: Please note that the above analysis is not an investment suggestion by “Capitalcore Ltd”. This post has been published only for educational purposes.