Gold price is getting ready for a free fall
Gold is losing its strength against USD. The bullish power seems to be decreasing and bears are about to take control. A strong support is below the price and is trying to pump the price up once more. the overall look of the price chart is bearish.
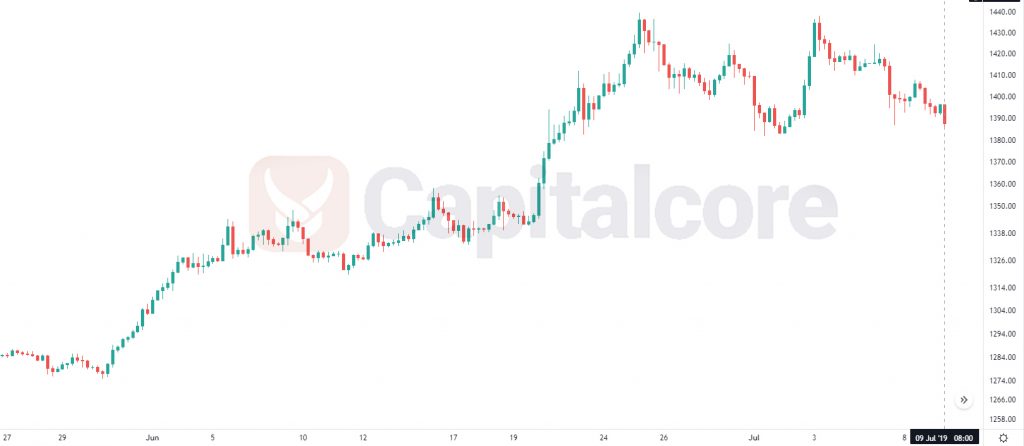
Chart Notes:
• Chart time-zone is UTC (+03:00)
• Candles’ time-frame is 4h.
The support rests at 1389.41 with resistance at 1403.21 which both lines are below the weekly pivot point at 1408.80. The EMA of 10 is moving horizontally in the horizontal channel and it is above the EMA of 200 and the EMA of 100. The RSI is moving below 50 level, the Stochastic is moving in low ranges and the MACD line is below the signal line in the negative territory. The ADX is showing sell signal. The price is below the Ichimoku Cloud and the Chinkou Span. The Tenkan-sen and the Kijun-sen are both showing a horizontal trend.
The support level breakthrough will confirm the bearish trend towards 1382.13.
• DISCLAIMER: Please note that the above analysis is not an investment suggestion by “Capitalcore Ltd”. This post has been published only for educational purposes.