Bulls have just began
The USD weakness is increasing the demand for the precious metals. On the chart Gold price could ascend up to the mid line of the channel and after breaking above the mid line, had a smooth pool back and retested the mid line, and now everything is ready for an ascend.
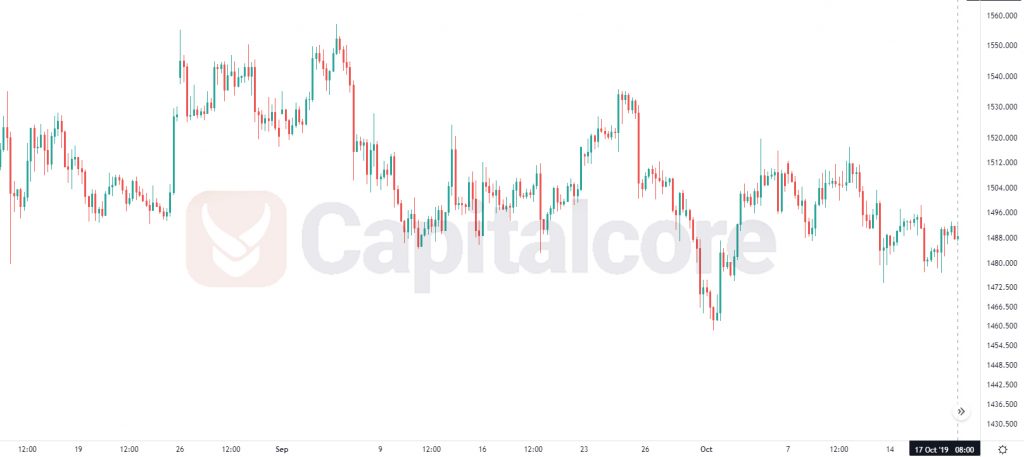
Chart Notes:
• Chart time-zone is UTC (+03:00)
• Candles’ time-frame is 4h.
The support rests at 1484.56 with resistance at 1500.35 which the weekly pivot point at 1496.33 is located in between the lines. The EMA of 10 is moving horizontally in the descendant channel and it is below the EMA of 200 and the EMA of 100. The RSI is moving on 50 level, the Stochastic is moving in overbought area and the MACD line is above the signal line in the positive territory. The ADX is showing buy signal. The price is in the Ichimoku Cloud and below the Chinkou Span. The Tenkan-sen and the Kijun-sen are both showing a horizontal trend.
Long positions are recommended towards 1505.
• DISCLAIMER: Please note that the above analysis is not an investment suggestion by “Capitalcore Ltd”. This post has been published only for educational purposes.