Bearish power could not take over the bulls
Today the Gold market is showing an upward movement which can be seen by several indicators. So, after the release of the minutes from the Federal Reserve’s meeting in June, Gold is edging higher. previously we saw that the descending step of the chart could not fall over 1855, in case this area of support is still valid we can be expecting a bullish trend to appear in the chart.
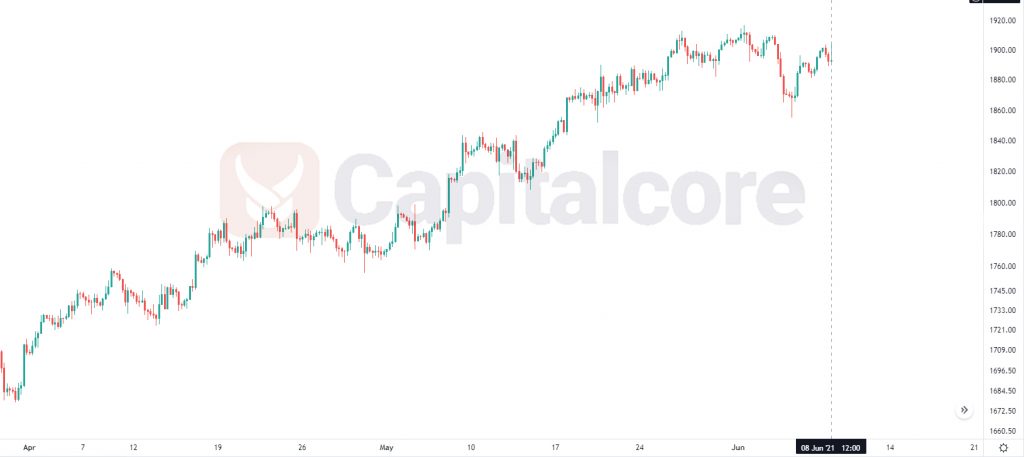
Chart Notes:
• Chart time-zone is UTC (+03:00)
• Candles’ time-frame is 4h.
the minutes from the Federal Reserve’s meeting in June, Gold is edging higher.
The support rests at 1796.05 with resistance at 1799.35. The pivot point at 1797.85 is located below the price line. The EMA of 10 is moving with bullish bias in the ascendant channel and it is above EMA of 200 and the EMA of 100. Stochastic is moving in low ranges. The RSI is moving toward the level of 70 and the ADX is showing a horizontal momentum. The MACD histogram is in negative territory.
• There is resistance at 1799.35, followed by resistance at 1801.15 and 1802.65.
• There is support at 1796.05, Below, there is 1794.55 and 1792.75.
• DISCLAIMER: Please note that the above analysis is not an investment suggestion by “Capitalcore Ltd”. This post has been published only for educational purposes.