After a significant decline, gold price looks to be starting a bullish trend
Gold is trying to cover the loss against USD. during the last days we witnessed a powerful descend of gold price comparing to USD. As CapitalCore Ltd team predicts, a bullish trend is about to start. Traders can open long positions, the target of the uptrend could be predetermined looking at Gold price chart.
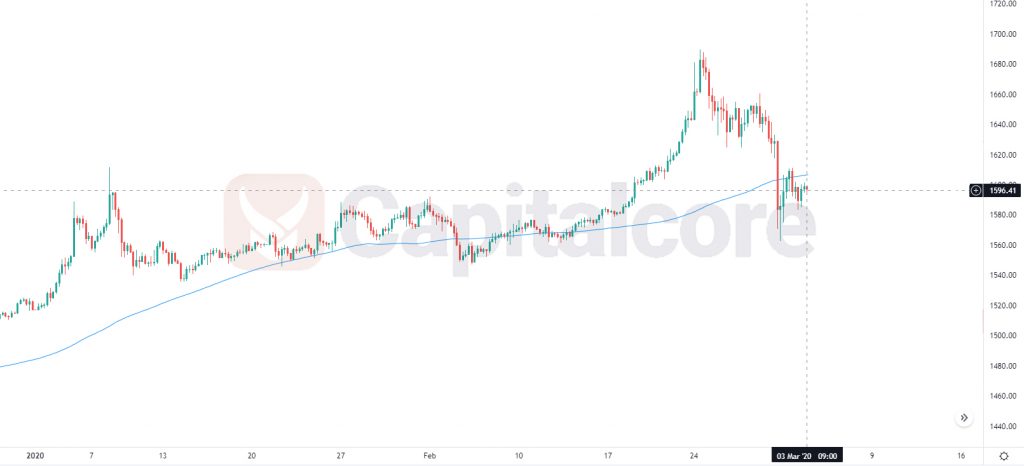
Chart Notes:
• Chart time-zone is UTC (+03:00)
• Candles’ time-frame is 4h.
The support rests at 1593.01 with resistance at 1618.01 which the weekly pivot point at 1607.47 is located in between the lines. The EMA of 10 is moving with bearish bias in the descendant channel and it is above the EMA of 200 and the EMA of 100. The RSI is rising towards 50 level, the Stochastic is showing upward momentum and the MACD line is below the signal line in the negative territory. The ADX is not showing any clear signals. The price is below the Ichimoku Cloud and above the Chinkou Span. The Tenkan-sen and the Kijun-sen are both showing a downward trend.
Long positions are recommended towards 1620.
• DISCLAIMER: Please note that the above analysis is not an investment suggestion by “Capitalcore Ltd”. This post has been published only for educational purposes.