Is the next move a sharp pump or a strong dump?
Based on the Labor Department report, inflation in April had its fastest speed in more than 12 years. Following the U.S. inflation report, the Gold market experienced a decline on Wednesday. The price is on an important spot; the chart has not give any clear buy or sell signal yet.
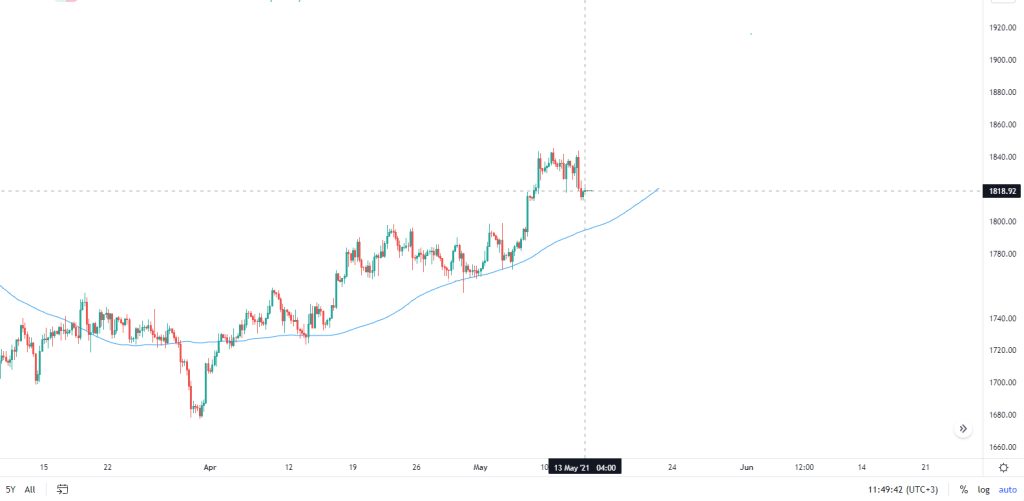
Chart Notes:
• Chart time-zone is UTC (+03:00)
• Candles’ time-frame is 4h.
The support rests at 1815.61 with resistance at 1818.96. The pivot point at 1817.43 is located below the price lines. The EMA of 10 is moving with bearish bias in the decadent channel and it is above EMA of 200 and the EMA of 100. Stochastic is moving under the level of 20 and generated a crossover buy signal. The RSI is moving around the level of 50 and the ADX is moving horizontally. The MACD histogram is in negative territory but also is ready to generate a buy signal.
• There is resistance at 1818.96, followed by resistance at 1820.78 and 1822.31.
• There is support at 1815.61. Below, there is 1814.08 and 1812.26.
• DISCLAIMER: Please note that the above analysis is not an investment suggestion by “Capitalcore Ltd”. This post has been published only for educational purposes.