- May 21, 2019
- Category: Market News
after a sharp bullish move a few weeks ago, gold price is right now on a critical spot once again. On Feb 20th, gold price started a bearish move in a descending channel; during the price movement, a strong support level at 1266 – 1270 was formed. Right now the price is touching that resistance level once more, this time this level is over-leaping with the mid-lane of the descending channel and is expected to be able to hold the price and pump it up once again. How ever we can never be sure about the price actions! so here we are checking three most possible theories for the next move of the price.
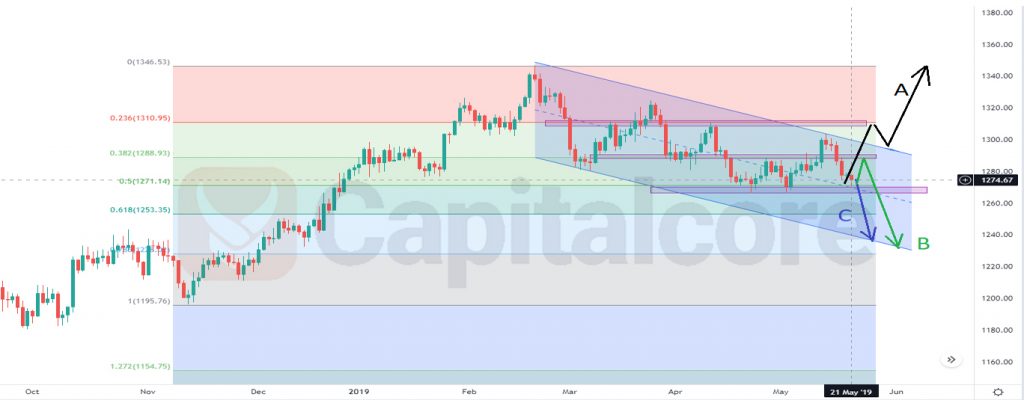
Chart Notes:
• Chart time-zone is UTC (+03:00)
• Candles’ time-frame is daily.
So based on what we can see on the chart, there are three possible outcomes for gold price in the next few days:
• A: the support level pushes the price up once again. in this case we will be waiting for a strong up trend since as it seems, the descending power of the price is weakening (the lower low of each small descending wave is being formed higher that the previous lower lows) so after getting a confirmation signal that shows us a trend reversal, we should be waiting to see gold price breaking up its descending channel, and after a possible retest of the top of the channel, will try to get to the next resistance level at 1345 – 1365.
• B: the price will retest the resistance level on 1289 – 1290 and after gaining descending power, will continue its way to the bottom of the channel which will be around 1240. in this case we should be waiting for a price reduction sign in 1 or 4 hour candles.
• C: the support level can not hold the price and we will see a descending wave to the bottom of the channel at about 1240.
• DISCLAIMER: Please note that the above analysis is not an investment suggestion by “Capitalcore Ltd”. This post has been published only for educational purposes.